

Investor Presentation Third Quarter FY 2022
Disclaimers 2 FORWARD-LOOKING STATEMENTS The words “Live Ventures,” “company” or “Company” refer to Live Ventures Incorporated and its wholly-owned subsidiaries. This Presentation contains "forward-looking statements" within the meaning of the Private Securities Litigation Reform Act of 1995. In accordance with the safe harbor provisions of this Act, statements contained herein that look forward in time that include everything other than historical information involve risks and uncertainties that may affect the company’s actual results. These forward-looking statements can be identified by terminology such as "will," "expects," "anticipates," "future," "intends," "plans," "believes," "estimates" and similar statements. These forward-looking statements include, but are not limited to, statements regarding annualized sales, annualized revenue, and adjusted EBITDA. These statements are based on various estimates and assumptions, whether or not identified in this presentation, believed to be reasonable at the time of preparation; however, no assurance can be given that any such estimates or valuations will ultimately be realized or that realizations will occur within the timeframes on which these estimates are made. Forward-looking information is inherently subjective and uncertain, and is not necessarily indicative of the future performance, nor is it a guaranty that such results will be attained. Forward-looking information is based on the assessment of various valuation and operating parameters, but actual future performance and market conditions are volatile and unpredictable. Live Ventures may also make written or oral forward-looking statements in its periodic reports to the U.S. Securities and Exchange Commission (the “SEC”) on Forms 10-K and 10-Q, Current Reports on Form 8-K, in its annual report to stockholders, in press releases and other written materials, and in oral statements made by its officers, directors or employees to third parties. There can be no assurance that such statements will prove to be accurate and there are a number of important factors that could cause actual results to differ materially from those expressed in any forward-looking statements made by the company, including, but not limited to, plans and objectives of management for future operations or products, the market acceptance or future success of the company’s products, and the company’s future financial performance. The company cautions that these forward-looking statements are further qualified by other factors, including, but not limited to, those set forth in the company’s Annual Report on Form 10-K for the fiscal year ended September 30, 2021 and Quarterly Report on Form 10-Q for the quarterly period ended March 31, 2022 (available at http://www.sec.gov). Live Ventures undertakes no obligation to publicly update or revise any statements in this Presentation, whether as a result of new information, future events, or otherwise. TRADEMARKS AND TRADENAMES Live Ventures owns or has the rights to various trademarks, service marks, and trade names that it uses in connection with the operation of its business. Solely for convenience, the trademarks, service marks, and trade names referred to in this presentation may appear without the ®, TM, or SM symbols; but, such references are not intended to indicate, in any way, that Live Ventures will not assert, to the fullest extent under applicable law, its rights or the right of the applicable licensor to these trademarks, service marks, and trade names.
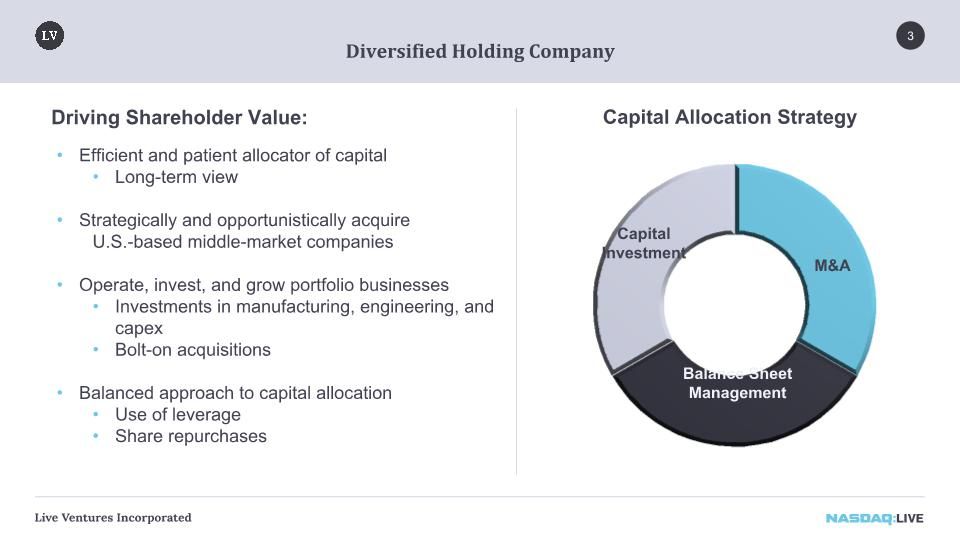
Capital Allocation Strategy Efficient and patient allocator of capital Long-term view Strategically and opportunistically acquire U.S.-based middle-market companies Operate, invest, and grow portfolio businesses Investments in manufacturing, engineering, and capex Bolt-on acquisitions Balanced approach to capital allocation Use of leverage Share repurchases 3 Diversified Holding Company Driving Shareholder Value:
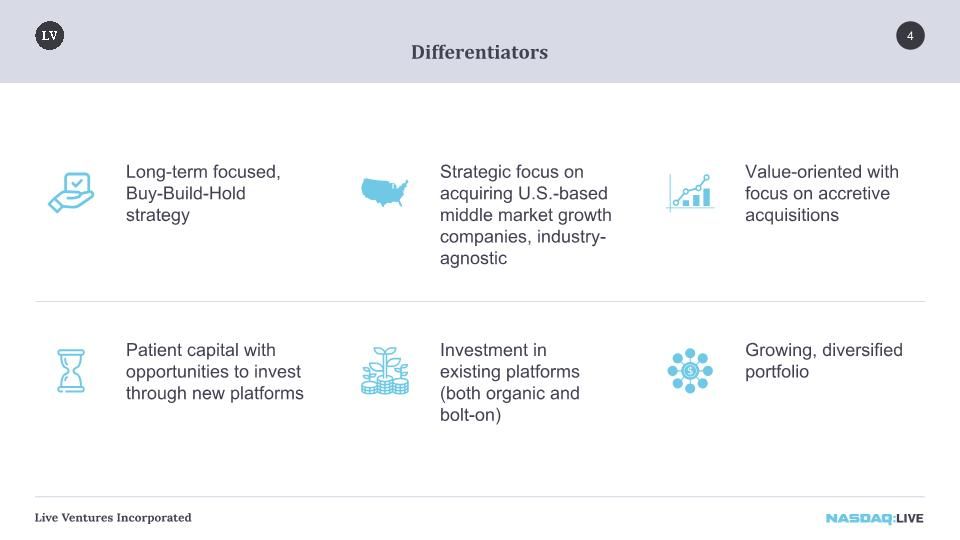
Differentiators Long-term focused, Buy-Build-Hold strategy Strategic focus on acquiring U.S.-based middle market growth companies, industry-agnostic Value-oriented with focus on accretive acquisitions Patient capital with opportunities to invest through new platforms Investment in existing platforms (both organic and bolt-on) Growing, diversified portfolio 4
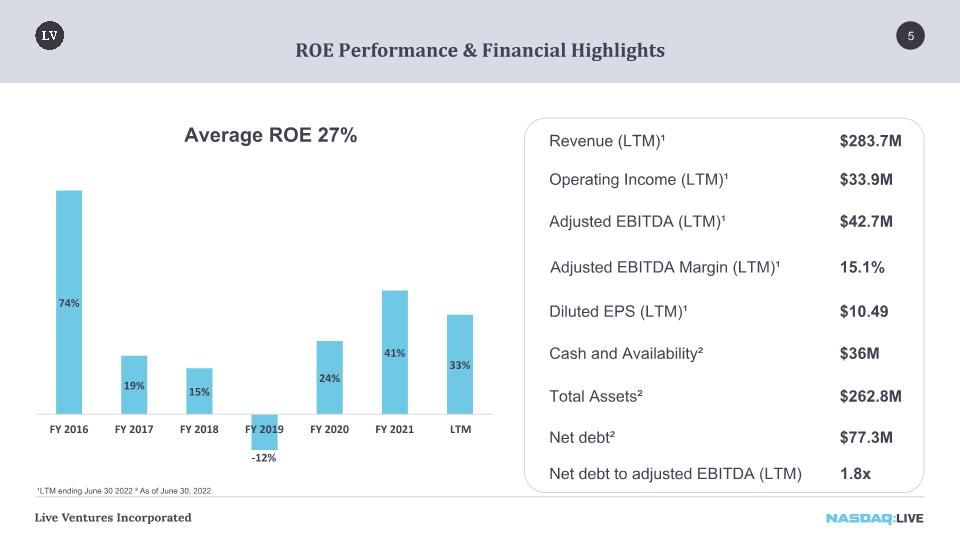
5 ROE Performance & Financial Highlights Average ROE 27% $42.7M Adjusted EBITDA (LTM)¹ $283.7M Revenue (LTM)¹ $33.9M Operating Income (LTM)¹ $36M Cash and Availability² $262.8M Total Assets² ¹LTM ending June 30 2022 ² As of June 30, 2022 15.1% Adjusted EBITDA Margin (LTM)¹ $10.49 Diluted EPS (LTM)¹ $77.3M Net debt² 1.8x Net debt to adjusted EBITDA (LTM)
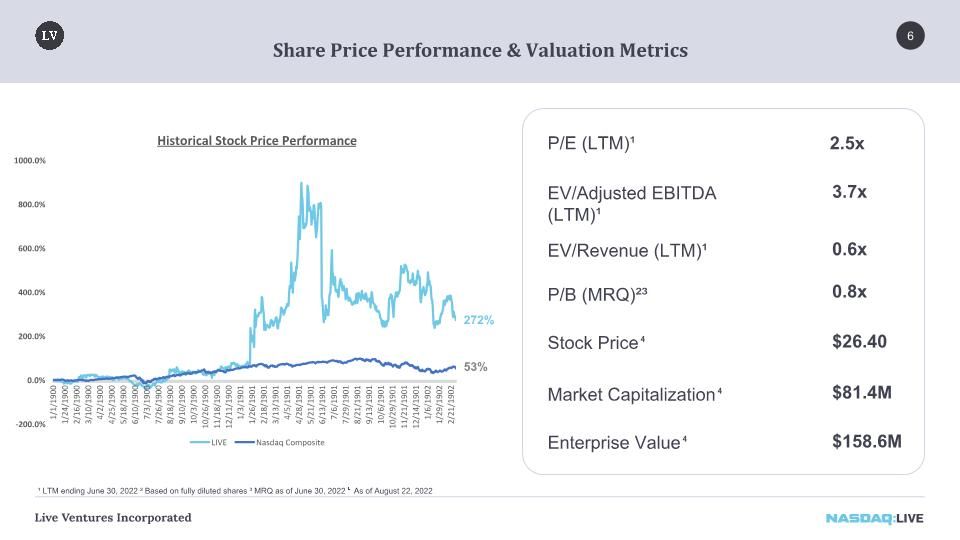
6 Share Price Performance & Valuation Metrics Enterprise Value⁴ 0.6x EV/Revenue (LTM)¹ 2.5x P/E (LTM)¹ 3.7x EV/Adjusted EBITDA (LTM)¹ $26.40 Stock Price⁴ $158.6M 0.8x P/B (MRQ)²³ ¹ LTM ending June 30, 2022 ² Based on fully diluted shares ³ MRQ as of June 30, 2022 ⁴ As of August 22, 2022 Market Capitalization⁴ $81.4M 272% 53%
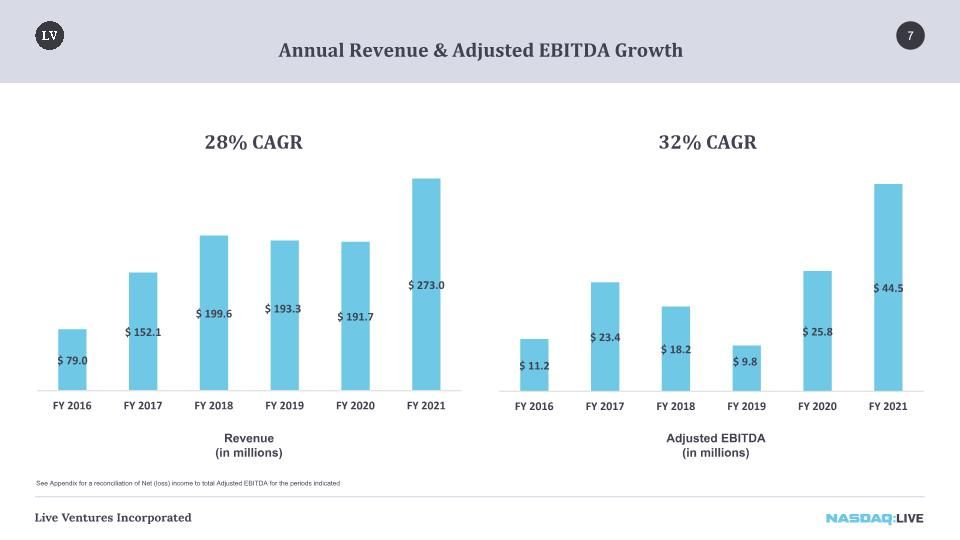
7 Annual Revenue & Adjusted EBITDA Growth See Appendix for a reconciliation of Net (loss) income to total Adjusted EBITDA for the periods indicated 28% CAGR 32% CAGR Revenue (in millions) Adjusted EBITDA (in millions)
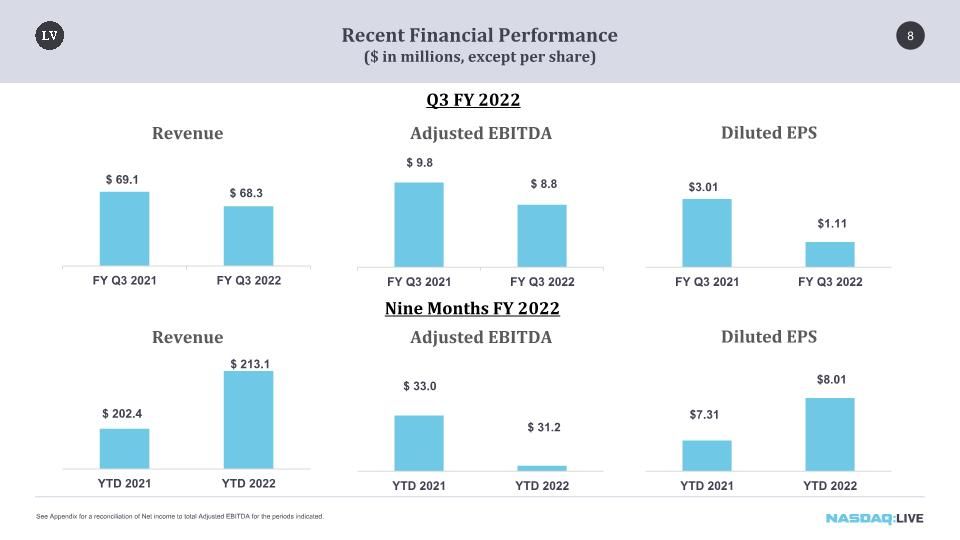
Recent Financial Performance ($ in millions, except per share) 8 Q3 FY 2022 Nine Months FY 2022 See Appendix for a reconciliation of Net income to total Adjusted EBITDA for the periods indicated.
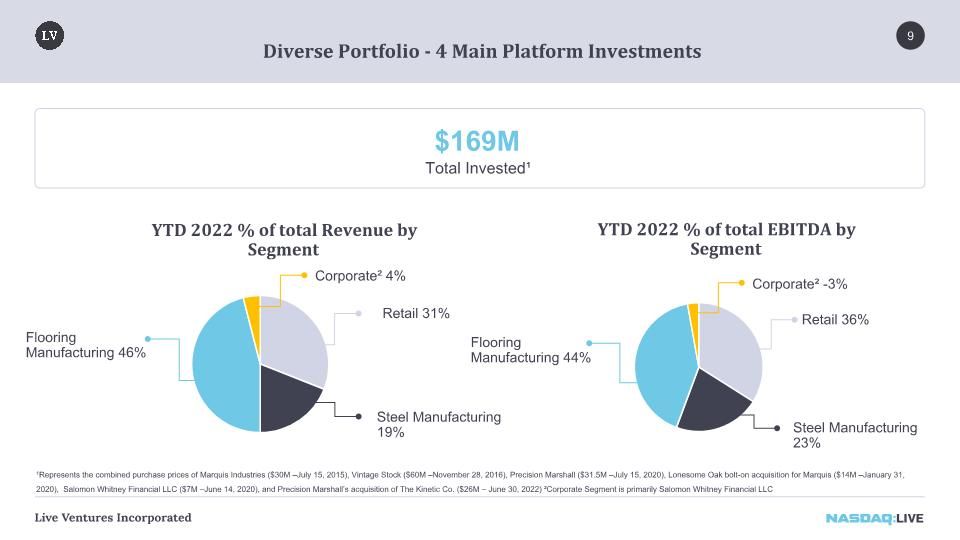
Diverse Portfolio - 4 Main Platform Investments 9 $169M Total Invested¹ YTD 2022 % of total Revenue by Segment Steel Manufacturing 19% Retail 31% Flooring Manufacturing 46% Corporate² 4% 1Represents the combined purchase prices of Marquis Industries ($30M –July 15, 2015), Vintage Stock ($60M –November 28, 2016), Precision Marshall ($31.5M –July 15, 2020), Lonesome Oak bolt-on acquisition for Marquis ($14M –January 31, 2020), Salomon Whitney Financial LLC ($7M –June 14, 2020), and Precision Marshall’s acquisition of The Kinetic Co. ($26M – June 30, 2022) ²Corporate Segment is primarily Salomon Whitney Financial LLC Retail 36% Steel Manufacturing 23% Flooring Manufacturing 44% Corporate² -3% YTD 2022 % of total EBITDA by Segment
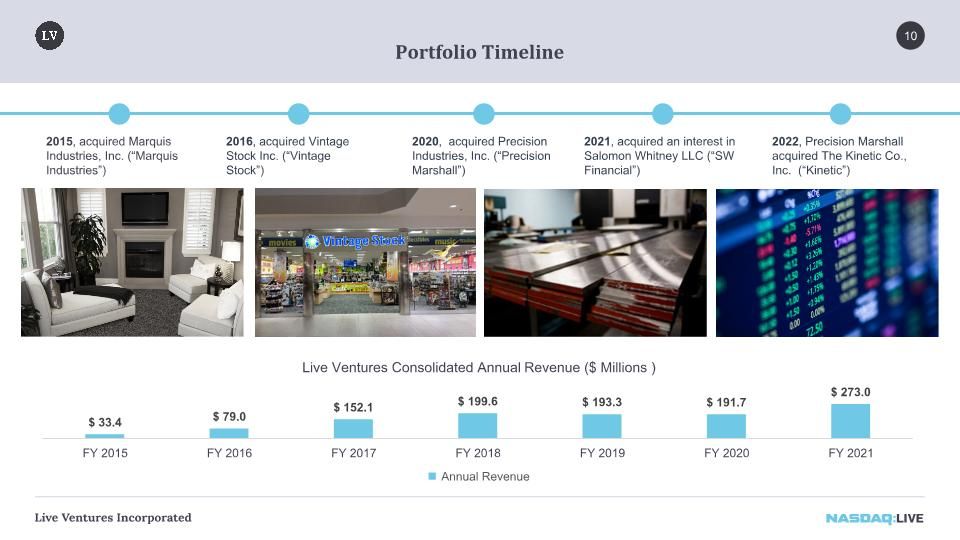
Portfolio Timeline 10 2015, acquired Marquis Industries, Inc. (“Marquis Industries”) 2016, acquired Vintage Stock Inc. (“Vintage Stock”) 2020, acquired Precision Industries, Inc. (“Precision Marshall”) 2021, acquired an interest in Salomon Whitney LLC (“SW Financial”) 2022, Precision Marshall acquired The Kinetic Co., Inc. (“Kinetic”)
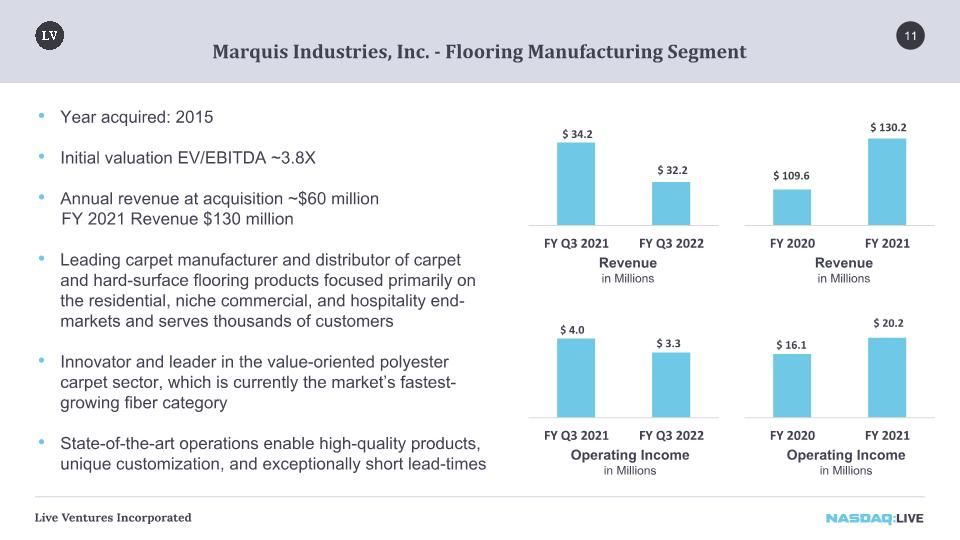
Marquis Industries, Inc. - Flooring Manufacturing Segment 11 Year acquired: 2015 Initial valuation EV/EBITDA ~3.8X Annual revenue at acquisition ~$60 million FY 2021 Revenue $130 million Leading carpet manufacturer and distributor of carpet and hard-surface flooring products focused primarily on the residential, niche commercial, and hospitality end-markets and serves thousands of customers Innovator and leader in the value-oriented polyester carpet sector, which is currently the market’s fastest-growing fiber category State-of-the-art operations enable high-quality products, unique customization, and exceptionally short lead-times Revenue in Millions Operating Income in Millions Revenue in Millions Operating Income in Millions
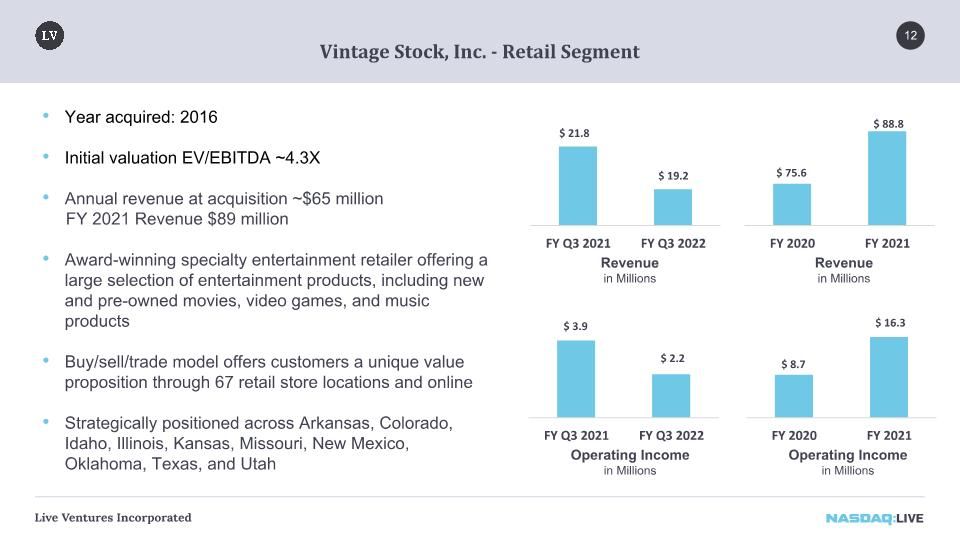
Operating Income in Millions Vintage Stock, Inc. - Retail Segment 12 Year acquired: 2016 Initial valuation EV/EBITDA ~4.3X Annual revenue at acquisition ~$65 million FY 2021 Revenue $89 million Award-winning specialty entertainment retailer offering a large selection of entertainment products, including new and pre-owned movies, video games, and music products Buy/sell/trade model offers customers a unique value proposition through 67 retail store locations and online Strategically positioned across Arkansas, Colorado, Idaho, Illinois, Kansas, Missouri, New Mexico, Oklahoma, Texas, and Utah Revenue in Millions Revenue in Millions Operating Income in Millions
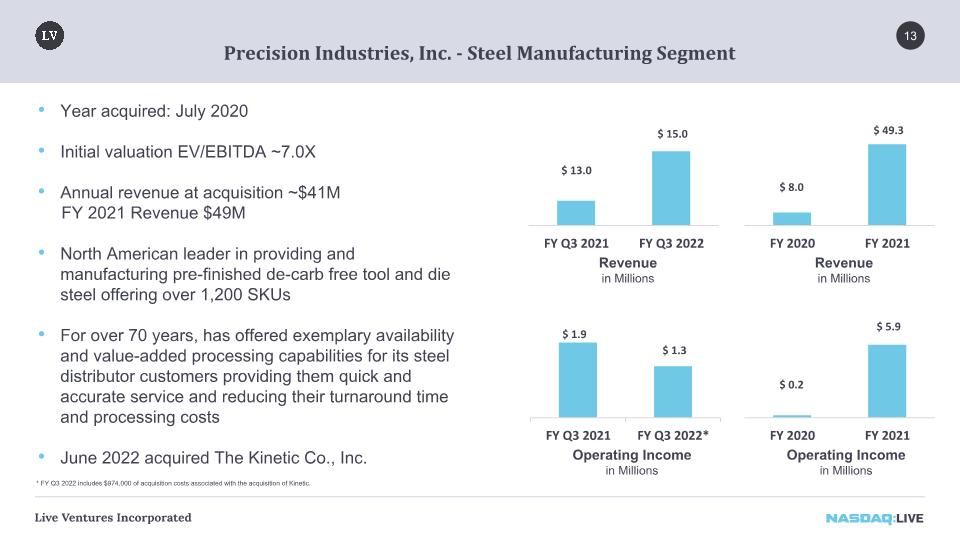
Operating Income in Millions Precision Industries, Inc. - Steel Manufacturing Segment 13 Year acquired: July 2020 Initial valuation EV/EBITDA ~7.0X Annual revenue at acquisition ~$41M FY 2021 Revenue $49M North American leader in providing and manufacturing pre-finished de-carb free tool and die steel offering over 1,200 SKUs For over 70 years, has offered exemplary availability and value-added processing capabilities for its steel distributor customers providing them quick and accurate service and reducing their turnaround time and processing costs June 2022 acquired The Kinetic Co., Inc. Revenue in Millions Revenue in Millions Operating Income in Millions * FY Q3 2022 includes $974,000 of acquisition costs associated with the acquisition of Kinetic.
Salomon Whitney LLC 14 Footnote: Live Ventures owns a 24.9% interest in SW Financial. SW Financial is consolidated into Live Ventures’ financial statements as a variable interest entity and is currently reported in the Company’s Corporate and Other Segment Year acquired: June 2021 Initial valuation EBITDA/EV ~2.5X Revenue at acquisition ~$13.9M Licensed broker-dealer and investment bank Over 70 registered representatives and is licensed to operate in all 50 states Provides a broad range of products and services, including broker retailing of equity and debt securities, private placement of securities, corporate finance consulting regarding mergers and acquisitions, broker selling of variable life insurance or annuities, and broker retailing of U.S. government and municipal securities
Investment Oversight / Management 15 Jon Isaac President & Chief Executive Officer Eric Althofer Chief Operating Officer & Managing Director Founder of the Isaac Organization, a privately held investment company, and the strategic investor behind Live Ventures. Mr. Isaac acquired the then named LiveDeal, a struggling company, in late 2011 and in 2015 repurposed Live Ventures into its current diversified holdings model Through both Isaac Organization and the Company, Mr. Isaac has closed numerous multi-faceted real estate transactions and traditional buy-out transactions with a focus on creative structuring and financing Prior to joining Live Ventures in 2021, Mr. Althofer served as a director of Capitala Investment Advisors, responsible for underwriting and executing middle-market debt transactions. Previously, Mr. Althofer also held roles in investment banking with Jefferies LLC and strategy and operations consulting at Deloitte Consulting David Verret Chief Financial Officer Prior to joining Live Ventures in 2021, Mr. Verret spent 10 years at Brinks Home Security™, where he served as the Chief Accounting Officer. In the preceding 13 years, he was with KPMG LLP and served as a senior manager in its audit practice
Acquisition Strategy 16 Companies in need of new ownership and outside capital to support growth, both organically and through acquisitions Target companies with annual earnings between $5 and $50 million Companies with a defensible market position and track record of stable earnings and cash flow Closely-held or family-founded businesses with a strong culture and management team that wants to stay with the business
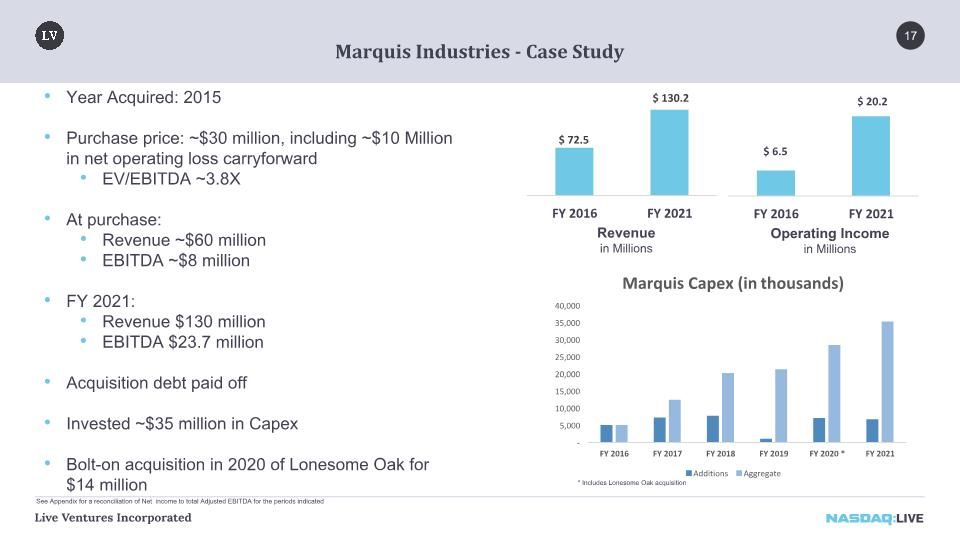
Marquis Industries - Case Study 17 Year Acquired: 2015 Purchase price: ~$30 million, including ~$10 Million in net operating loss carryforward EV/EBITDA ~3.8X At purchase: Revenue ~$60 million EBITDA ~$8 million FY 2021: Revenue $130 million EBITDA $23.7 million Acquisition debt paid off Invested ~$35 million in Capex Bolt-on acquisition in 2020 of Lonesome Oak for $14 million Revenue in Millions Operating Income in Millions * Includes Lonesome Oak acquisition See Appendix for a reconciliation of Net income to total Adjusted EBITDA for the periods indicated
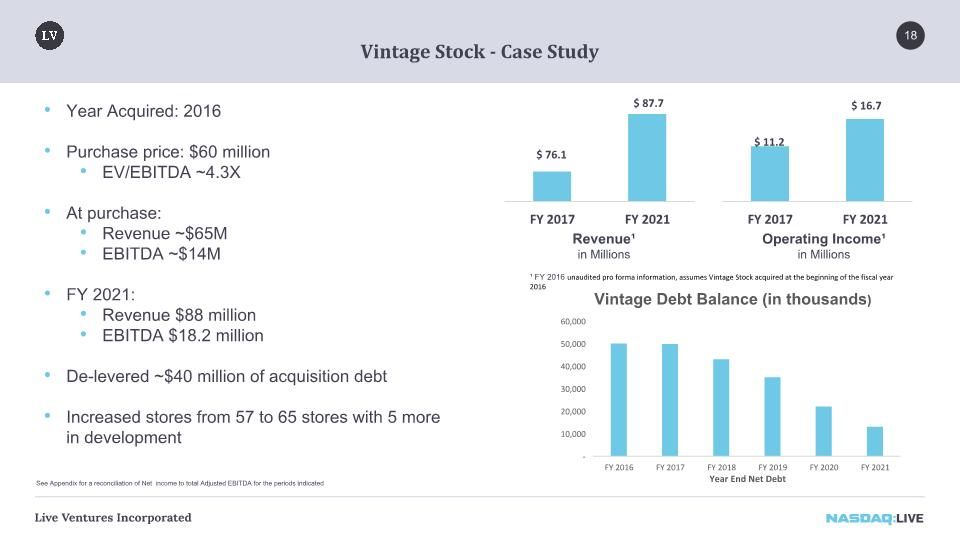
Vintage Stock - Case Study 18 Year Acquired: 2016 Purchase price: $60 million EV/EBITDA ~4.3X At purchase: Revenue ~$65M EBITDA ~$14M FY 2021: Revenue $88 million EBITDA $18.2 million De-levered ~$40 million of acquisition debt Increased stores from 57 to 65 stores with 5 more in development Revenue¹ in Millions Operating Income¹ in Millions ¹ FY 2016 unaudited pro forma information, assumes Vintage Stock acquired at the beginning of the fiscal year 2016 See Appendix for a reconciliation of Net income to total Adjusted EBITDA for the periods indicated
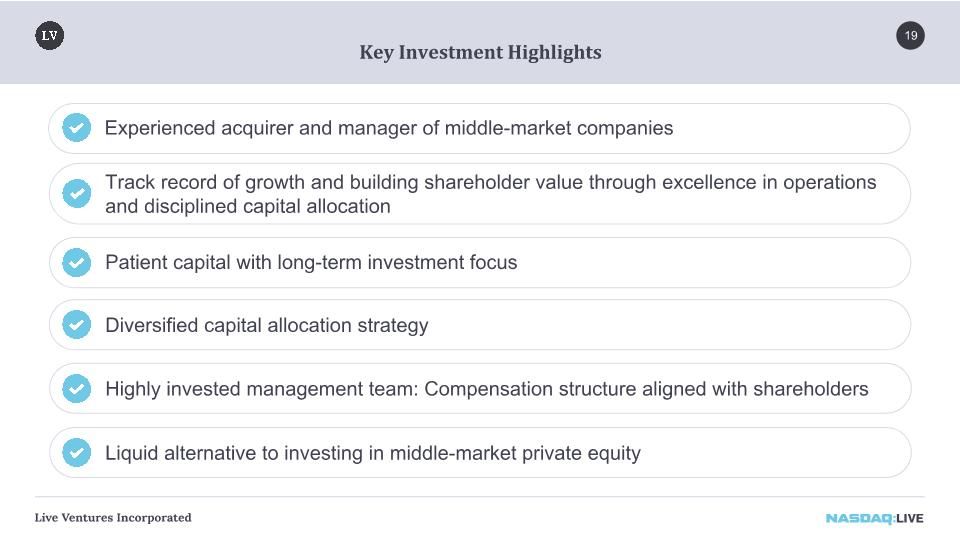
Key Investment Highlights 19 Track record of growth and building shareholder value through excellence in operations and disciplined capital allocation Patient capital with long-term investment focus Diversified capital allocation strategy Highly invested management team: Compensation structure aligned with shareholders Liquid alternative to investing in middle-market private equity Experienced acquirer and manager of middle-market companies

Appendix
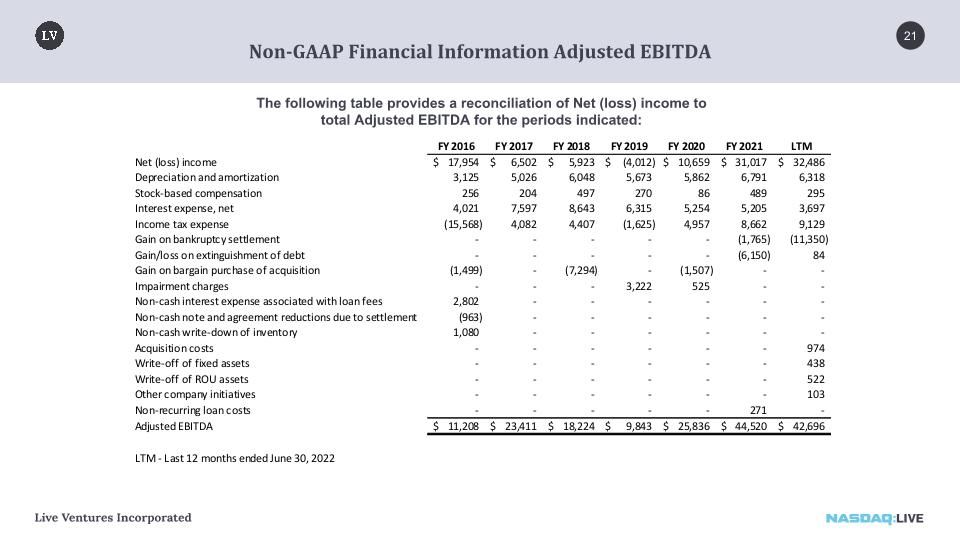
Non-GAAP Financial Information Adjusted EBITDA 21 The following table provides a reconciliation of Net (loss) income to total Adjusted EBITDA for the periods indicated:
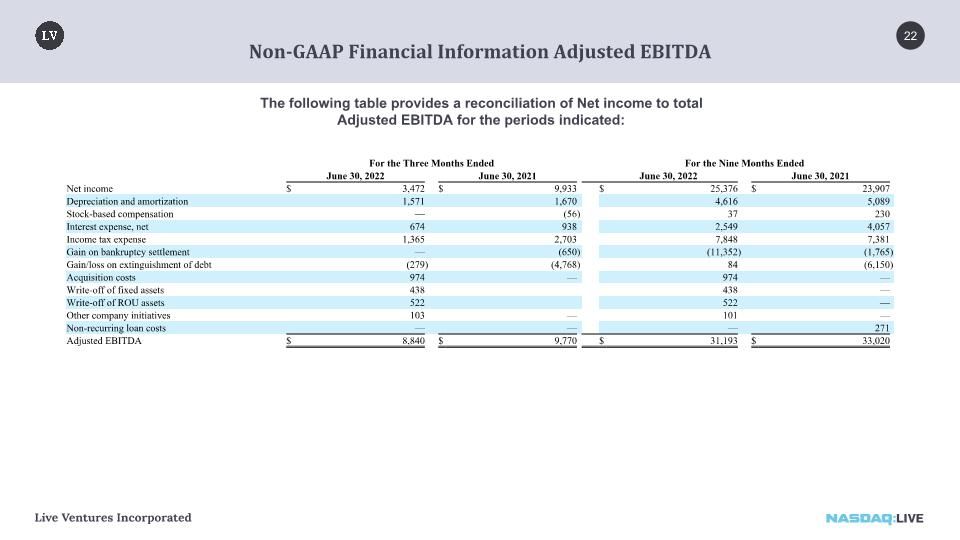
Non-GAAP Financial Information Adjusted EBITDA 22 The following table provides a reconciliation of Net income to total Adjusted EBITDA for the periods indicated: For the Three Months Ended For the Nine Months Ended June 30, 2022 June 30, 2021 June 30, 2022 June 30, 2021 Net income $ 3,472 $ 9,933 $ 25,376 $ 23,907 Depreciation and amortization 1,571 1,670 4,616 5,089 Stock-based compensation — (56 ) 37 230 Interest expense, net 674 938 2,549 4,057 Income tax expense 1,365 2,703 7,848 7,381 Gain on bankruptcy settlement — (650 ) (11,352 ) (1,765 ) Gain/loss on extinguishment of debt (279 ) (4,768 ) 84 (6,150 ) Acquisition costs 974 — 974 — Write-off of fixed assets 438 438 — Write-off of ROU assets 522 522 — Other company initiatives 103 — 101 — Non-recurring loan costs — — — 271 Adjusted EBITDA $ 8,840 $ 9,770 $ 31,193 $ 33,020
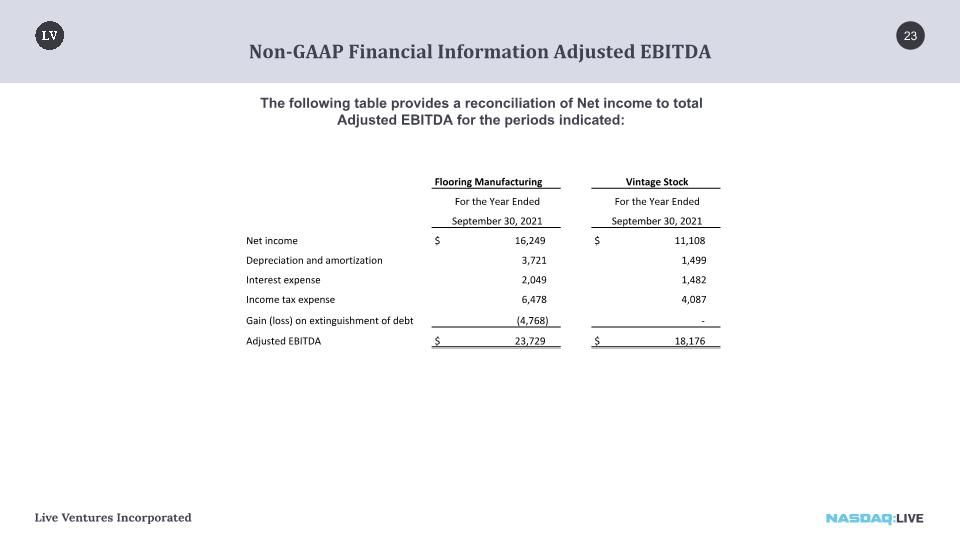
Non-GAAP Financial Information Adjusted EBITDA 23 The following table provides a reconciliation of Net income to total Adjusted EBITDA for the periods indicated: Flooring Manufacturing Vintage Stock For the Year Ended For the Year Ended September 30, 2021 September 30, 2021 Net income $ 16,249 $ 11,108 Depreciation and amortization 3,721 1,499 Interest expense 2,049 1,482 Income tax expense 6,478 4,087 Gain (loss) on extinguishment of debt (4,768) - Adjusted EBITDA $ 23,729 $ 18,176
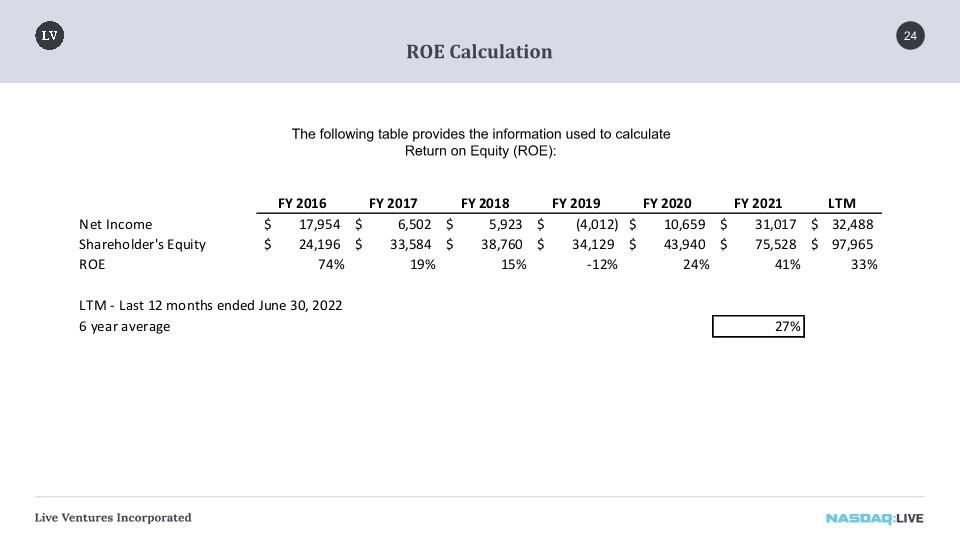
ROE Calculation 24 The following table provides the information used to calculate Return on Equity (ROE):
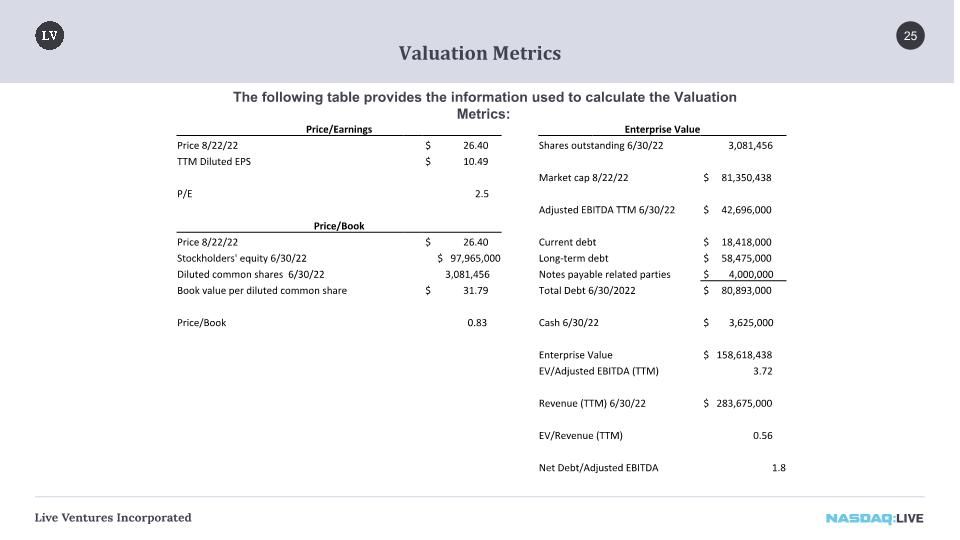
Valuation Metrics 25 The following table provides the information used to calculate the Valuation Metrics: Price/Earnings Enterprise Value Price 8/22/22 $ 26.40 Shares outstanding 6/30/22 3,081,456 TTM Diluted EPS $ 10.49 Market cap 8/22/22 $ 81,350,438 P/E 2.5 Adjusted EBITDA TTM 6/30/22 $ 42,696,000 Price/Book Price 8/22/22 $ 26.40 Current debt $ 18,418,000 Stockholders' equity 6/30/22 $ 97,965,000 Long-term debt $ 58,475,000 Diluted common shares 6/30/22 3,081,456 Notes payable related parties $ 4,000,000 Book value per diluted common share $ 31.79 Total Debt 6/30/2022 $ 80,893,000 Price/Book 0.83 Cash 6/30/22 $ 3,625,000 Enterprise Value $ 158,618,438 EV/Adjusted EBITDA (TTM) 3.72 Revenue (TTM) 6/30/22 $ 283,675,000 EV/Revenue (TTM) 0.56 Net Debt/Adjusted EBITDA 1.8
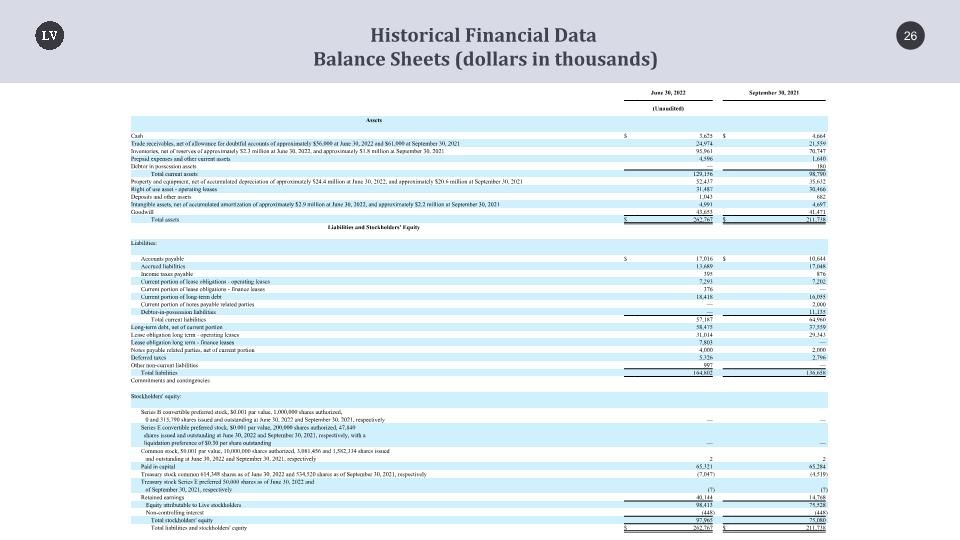
26 Historical Financial Data Balance Sheets (dollars in thousands) June 30, 2022 September 30, 2021 (Unaudited) Assets Cash $ 3,625 $ 4,664 Trade receivables, net of allowance for doubtful accounts of approximately $56,000 at June 30, 2022 and $61,000 at September 30, 2021 24,974 21,559 Inventories, net of reserves of approximately $2.3 million at June 30, 2022, and approximately $1.8 million at September 30, 2021 95,961 70,747 Prepaid expenses and other current assets 4,596 1,640 Debtor in possession assets — 180 Total current assets 129,156 98,790 Property and equipment, net of accumulated depreciation of approximately $24.4 million at June 30, 2022, and approximately $20.6 million at September 30, 2021 52,437 35,632 Right of use asset - operating leases 31,487 30,466 Deposits and other assets 1,043 682 Intangible assets, net of accumulated amortization of approximately $2.9 million at June 30, 2022, and approximately $2.2 million at September 30, 2021 4,991 4,697 Goodwill 43,653 41,471 Total assets $ 262,767 $ 211,738 Liabilities and Stockholders' Equity Liabilities: Accounts payable $ 17,016 $ 10,644 Accrued liabilities 13,689 17,048 Income taxes payable 395 876 Current portion of lease obligations - operating leases 7,293 7,202 Current portion of lease obligations - finance leases 376 — Current portion of long-term debt 18,418 16,055 Current portion of notes payable related parties — 2,000 Debtor-in-possession liabilities — 11,135 Total current liabilities 57,187 64,960 Long-term debt, net of current portion 58,475 37,559 Lease obligation long term - operating leases 31,014 29,343 Lease obligation long term - finance leases 7,803 — Notes payable related parties, net of current portion 4,000 2,000 Deferred taxes 5,326 2,796 Other non-current liabilities 997 — Total liabilities 164,802 136,658 Commitments and contingencies Stockholders' equity: Series B convertible preferred stock, $0.001 par value, 1,000,000 shares authorized, 0 and 315,790 shares issued and outstanding at June 30, 2022 and September 30, 2021, respectively — — Series E convertible preferred stock, $0.001 par value, 200,000 shares authorized, 47,840 shares issued and outstanding at June 30, 2022 and September 30, 2021, respectively, with a liquidation preference of $0.30 per share outstanding — — Common stock, $0.001 par value, 10,000,000 shares authorized, 3,081,456 and 1,582,334 shares issued and outstanding at June 30, 2022 and September 30, 2021, respectively 2 2 Paid in capital 65,321 65,284 Treasury stock common 614,348 shares as of June 30, 2022 and 534,520 shares as of September 30, 2021, respectively (7,047 ) (4,519 ) Treasury stock Series E preferred 50,000 shares as of June 30, 2022 and of September 30, 2021, respectively (7 ) (7 ) Retained earnings 40,144 14,768 Equity attributable to Live stockholders 98,413 75,528 Non-controlling interest (448 ) (448 ) Total stockholders' equity 97,965 75,080 Total liabilities and stockholders' equity $ 262,767 $ 211,738
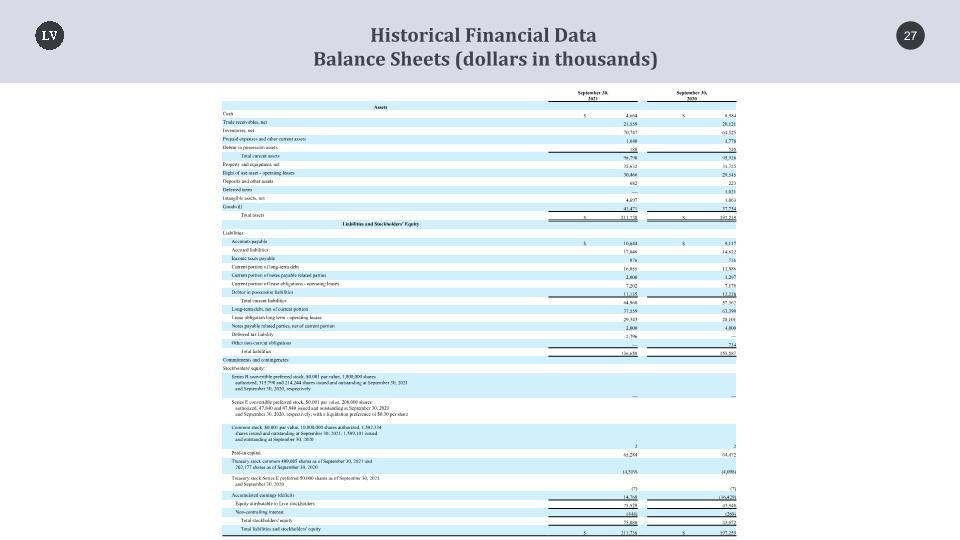
27 Historical Financial Data Balance Sheets (dollars in thousands) September 30, 2021 September 30, 2020 Assets Cash $ 4,664 $ 8,984 Trade receivables, net 21,559 20,121 Inventories, net 70,747 64,525 Prepaid expenses and other current assets 1,640 1,778 Debtor in possession assets 180 520 Total current assets 98,790 95,928 Property and equipment, net 35,632 31,725 Right of use asset - operating leases 30,466 29,545 Deposits and other assets 682 223 Deferred taxes — 1,021 Intangible assets, net 4,697 1,063 Goodwill 41,471 37,754 Total assets $ 211,738 $ 197,259 Liabilities and Stockholders' Equity Liabilities: Accounts payable $ 10,644 $ 9,117 Accrued liabilities 17,048 14,822 Income taxes payable 876 736 Current portion of long-term debt 16,055 11,986 Current portion of notes payable related parties 2,000 1,297 Current portion of lease obligations - operating leases 7,202 7,176 Debtor in possession liabilities 11,135 12,228 Total current liabilities 64,960 57,362 Long-term debt, net of current portion 37,559 63,390 Lease obligation long term - operating leases 29,343 28,101 Notes payable related parties, net of current portion 2,000 4,000 Deferred tax liability 2,796 — Other non-current obligations — 734 Total liabilities 136,658 153,587 Commitments and contingencies Stockholders' equity: Series B convertible preferred stock, $0.001 par value, 1,000,000 shares authorized, 315,790 and 214,244 shares issued and outstanding at September 30, 2021 and September 30, 2020, respectively — — Series E convertible preferred stock, $0.001 par value, 200,000 shares authorized, 47,840 and 47,840 issued and outstanding at September 30, 2021 and September 30, 2020, respectively, with a liquidation preference of $0.30 per share — — Common stock, $0.001 par value, 10,000,000 shares authorized, 1,582,334 shares issued and outstanding at September 30, 2021; 1,589,101 issued and outstanding at September 30, 2020 2 2 Paid-in capital 65,284 64,472 Treasury stock common 499,085 shares as of September 30, 2021 and 262,177 shares as of September 30, 2020 (4,519) (4,098) Treasury stock Series E preferred 50,000 shares as of September 30, 2021 and September 30, 2020 (7) (7) Accumulated earnings (deficit) 14,768 (16,429) Equity attributable to Live stockholders 75,528 43,940 Non-controlling interest (448) (268) Total stockholders' equity 75,080 43,672 Total liabilities and stockholders' equity $ 211,738 $ 197,259
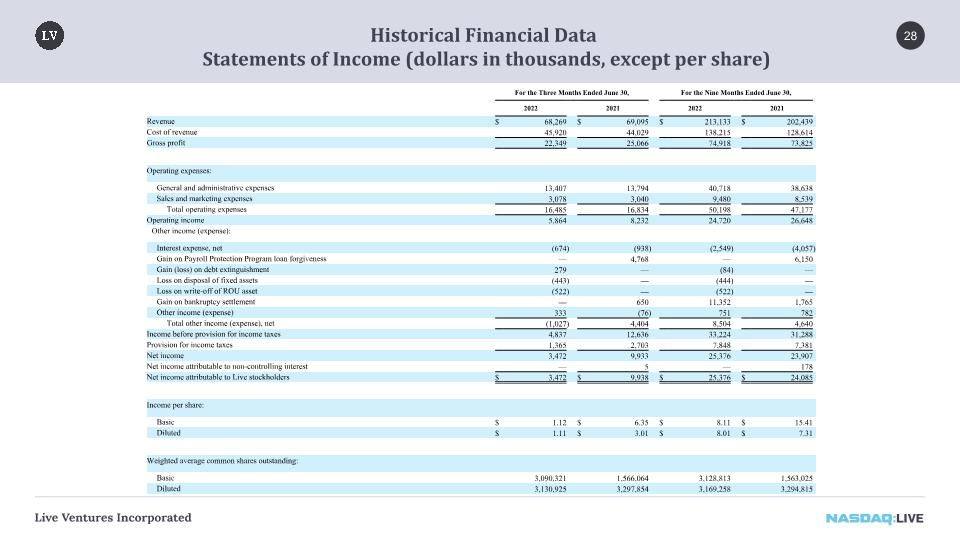
28 Historical Financial Data Statements of Income (dollars in thousands, except per share) For the Three Months Ended June 30, For the Nine Months Ended June 30, 2022 2021 2022 2021 Revenue $ 68,269 $ 69,095 $ 213,133 $ 202,439 Cost of revenue 45,920 44,029 138,215 128,614 Gross profit 22,349 25,066 74,918 73,825 Operating expenses: General and administrative expenses 13,407 13,794 40,718 38,638 Sales and marketing expenses 3,078 3,040 9,480 8,539 Total operating expenses 16,485 16,834 50,198 47,177 Operating income 5,864 8,232 24,720 26,648 Other income (expense): Interest expense, net (674 ) (938 ) (2,549 ) (4,057 ) Gain on Payroll Protection Program loan forgiveness — 4,768 — 6,150 Gain (loss) on debt extinguishment 279 — (84 ) — Loss on disposal of fixed assets (443 ) — (444 ) — Loss on write-off of ROU asset (522 ) — (522 ) — Gain on bankruptcy settlement — 650 11,352 1,765 Other income (expense) 333 (76 ) 751 782 Total other income (expense), net (1,027 ) 4,404 8,504 4,640 Income before provision for income taxes 4,837 12,636 33,224 31,288 Provision for income taxes 1,365 2,703 7,848 7,381 Net income 3,472 9,933 25,376 23,907 Net income attributable to non-controlling interest — 5 — 178 Net income attributable to Live stockholders $ 3,472 $ 9,938 $ 25,376 $ 24,085 Income per share: Basic $ 1.12 $ 6.35 $ 8.11 $ 15.41 Diluted $ 1.11 $ 3.01 $ 8.01 $ 7.31 Weighted average common shares outstanding: Basic 3,090,321 1,566,064 3,128,813 1,563,025 Diluted 3,130,925 3,297,854 3,169,258 3,294,815
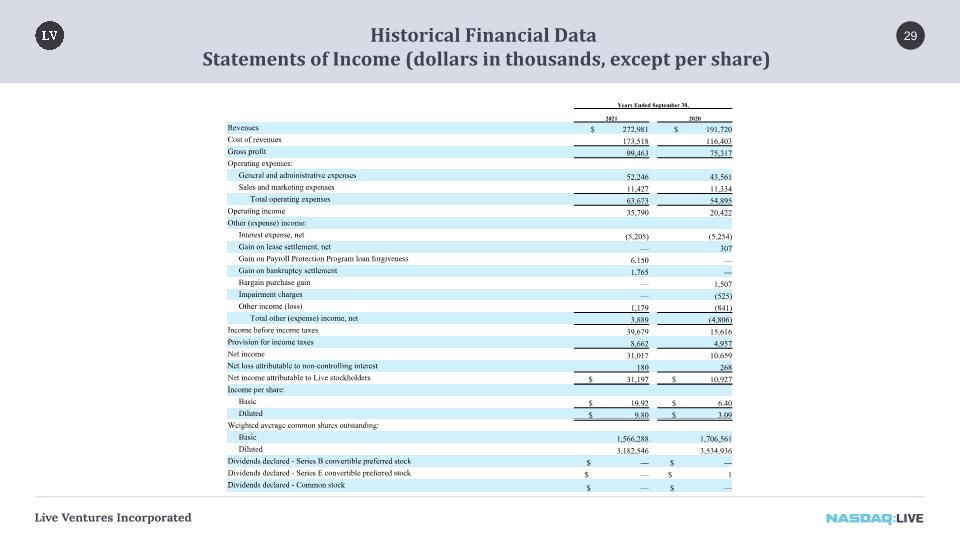
29 Historical Financial Data Statements of Income (dollars in thousands, except per share) Years Ended September 30, 2021 2020 Revenues $ 272,981 $ 191,720 Cost of revenues 173,518 116,403 Gross profit 99,463 75,317 Operating expenses: General and administrative expenses 52,246 43,561 Sales and marketing expenses 11,427 11,334 Total operating expenses 63,673 54,895 Operating income 35,790 20,422 Other (expense) income: Interest expense, net (5,205) (5,254) Gain on lease settlement, net — 307 Gain on Payroll Protection Program loan forgiveness 6,150 — Gain on bankruptcy settlement 1,765 — Bargain purchase gain — 1,507 Impairment charges — (525) Other income (loss) 1,179 (841) Total other (expense) income, net 3,889 (4,806) Income before income taxes 39,679 15,616 Provision for income taxes 8,662 4,957 Net income 31,017 10,659 Net loss attributable to non-controlling interest 180 268 Net income attributable to Live stockholders $ 31,197 $ 10,927 Income per share: Basic $ 19.92 $ 6.40 Diluted $ 9.80 $ 3.09 Weighted average common shares outstanding: Basic 1,566,288 1,706,561 Diluted 3,182,546 3,534,936 Dividends declared - Series B convertible preferred stock $ — $ — Dividends declared - Series E convertible preferred stock $ — $ 1 Dividends declared - Common stock $ — $ —

325 E Warm Springs Rd #102 Las Vegas, NV 89119 Phone: 725.500.5597 Email: gpowell@liveventures.com