|
|
x
|
ANNUAL REPORT PURSUANT TO SECTION
13 OR 15(d) OF THE SECURITIES EXCHANGE ACT OF
1934
|
|
|
¨
|
TRANSITION REPORT UNDER SECTION
13 OR 15 (d) OF THE SECURITIES EXCHANGE ACT OF
1934
|
|
Nevada
|
85-0206668
|
|||
|
(State
or Other Jurisdiction of Incorporation or
Organization) |
(IRS
Employer Identification No.)
|
|
2490
East Sunset Road, Suite 100
Las
Vegas, Nevada
|
89120
|
|||
|
(Address
of principal executive offices)
|
(Zip
Code)
|
|
Large
accelerated filer o
|
Accelerated
filer o
|
|
|
Non-accelerated
filer o (Do
not check if a smaller reporting company)
|
Smaller
reporting company x
|
|
Page
|
|||
|
3
|
|||
|
9
|
|||
|
16
|
|||
|
17
|
|||
|
17
|
|||
|
18
|
|||
|
18
|
|||
|
20
|
|||
|
20
|
|||
|
31
|
|||
|
32
|
|||
|
33
|
|||
|
34
|
|||
|
35
|
|||
|
36
|
|||
|
37
|
|||
|
38
|
|||
|
56
|
|||
|
56
|
|||
|
Item
9B.
|
Other Information
|
63
|
|
|
57
|
|||
|
57
|
|||
|
57
|
|||
|
57
|
|||
|
57
|
|||
|
57
|
|||
|
63
|
|||
|
|
§
|
Website
URL acquisition services whereby we obtain website address names on behalf
of our small business clients;
|
|
|
§
|
Website
development and deployment services where we create, house and manage
websites on behalf of our small business
clients;
|
|
|
§
|
Website
traffic and audience development services which provides sophisticated
search engine marketing techniques, access to our own websites,
partnerships with other websites and other techniques to generate traffic
to our customers’ websites, whether created and housed by us or
not;
|
|
|
§
|
Website
analytics and performance reports that generate information for our
customers about activities on their websites and lead activities for their
businesses based on Internet
activities;
|
|
|
§
|
Directory
services whereby we provide both basic and enhanced directory listings for
our customers on our own directory and on partner
directories:
|
|
|
·
|
Larger
font.
|
|
|
·
|
Bolded business
name.
|
|
|
·
|
A “tagline” whereby the
advertiser can differentiate itself from its
competitors.
|
|
|
·
|
Submission of location to search
engines.
|
|
|
·
|
Map
directions.
|
|
|
·
|
A link to the advertiser’s own
webpage and email address.
|
|
|
·
|
Additional distribution network
for preferred listings. This feature gives additional exposure to our IAP
advertisers by placing their preferred listing on several online directory
systems. There currently is no charge to the IAP advertiser for
these additional channels of
distribution.
|
|
|
§
|
Website
acquisition whereby we obtain website address names on behalf of our small
business clients;
|
|
|
§
|
Website
development and deployment services where we create, house and manage
websites on behalf of our small business
clients;
|
|
|
§
|
Website
traffic and audience development whereby we provide sophisticated search
engine marketing techniques, access to our own websites, partnerships with
other websites and other techniques to generate traffic to our customers’
websites, whether created and housed by us or
not;
|
|
|
§
|
Website
analytics and performance reports which generate information for our
customers about activities on their websites and lead activities for their
businesses based on Internet activities;
and
|
|
|
§
|
Directory
services that provide both basic and enhanced directory listings for our
customers on our own directory and on partner
directories.
|
|
|
·
|
More current and extensive
listing information;
|
|
|
·
|
Immediate access to business
listings across the nation from any location;
|
|
|
·
|
Broad accessibility via computers
and hand-held devices, such as mobile phones and personal digital
assistants
|
|
|
·
|
Features such as mapping, direct
calling to the advertiser, and e-mail at the click of a button also may be
available;
|
|
|
·
|
Linear scaling architecture using
low cost commodity hardware;
|
|
|
·
|
An architecture based on
redundancy for scalable quick user responses;
|
|
|
·
|
Proven search technology which
scales for large volumes;
|
|
|
·
|
Enhanced security using HTTPS,
Encryption, and data obfuscation;
and
|
|
|
·
|
Internationalized Architecture
for quick localization.
|
|
|
·
|
We
have cross-marketing arrangements with reciprocal linking of websites
without any compensation to either party. These arrangements increase the
page views for our advertisers’ listings by being listed on the linked
websites. These co-promotional arrangements typically are terminable with
one month’s notice.
|
|
|
We
have an agreement with Google, Inc. designating us as an Authorized
Reseller of the Google AdWords advertising system, which also provides us
with access to Google training and services that we can then utilize on
behalf of our small business
clients.
|
|
|
·
|
We have an agreement with Yahoo!
Search Services to provide visibility to our website so that we can
provide traffic to our advertisers. In exchange for monthly fees, Yahoo!
Search Services assists in helping us to be one of the highest placed
sites when Yellow Pages searches are done on major search engines, such as
MSN and Yahoo!.
|
|
|
·
|
We began featuring Yelp’s 1.8 million
customer reviews on our Yellow Pages platforms, giving LiveDeal users an
enormous wealth of user-generated content about local area
businesses.
|
|
|
·
|
some competitors have longer
operating histories and greater financial and other resources than we have
and are in better financial condition than we
are;
|
|
|
·
|
some competitors have better name
recognition, as well as larger, more established, and more extensive
marketing, customer service, and customer support capabilities than we
have;
|
|
|
·
|
some competitors may supply a
broader range of services, enabling them to serve more or all of their
customers’ needs;
|
|
|
·
|
some competitors may be able to
better adapt to changing market conditions and customer demand;
and
|
|
|
·
|
barriers to entry are not
significant. As a result, other companies that are not
currently involved in the online marketing business may enter the market
or develop technology that reduces the need for our
services.
|
|
|
·
|
fluctuating demand for our
services, which may depend on a number of factors including:
|
|
|
o
|
changes in economic conditions
and our IAP advertisers’
profitability,
|
|
o
|
IAP advertiser refunds or
cancellations, and
|
|
|
o
|
our ability to continue to bill
through existing means;
|
|
|
·
|
market acceptance of new or
enhanced versions of our services or
products;
|
|
|
·
|
price competition or pricing
changes by us or our
competitors;
|
|
|
·
|
new product offerings or other
actions by our competitors;
|
|
|
·
|
the ability of our check
processing service providers to continue to process and provide billing
information regarding our solicitation
checks;
|
|
|
·
|
the amount and timing of
expenditures for expansion of our operations, including the hiring of new
employees, capital expenditures, and related
costs;
|
|
|
·
|
technical difficulties or
failures affecting our systems or the Internet in
general;
|
|
|
·
|
a decline in Internet traffic at
our website; and
|
|
|
·
|
the fixed nature of a significant
amount of our operating
expenses.
|
|
|
·
|
the pace of expansion of our
operations;
|
|
|
·
|
our need to respond to
competitive pressures; and
|
|
|
·
|
future acquisitions of
complementary products, technologies or
businesses.
|
|
|
·
|
cease selling or using any of our
products that incorporate the challenged intellectual property, which
would adversely affect our
revenue;
|
|
|
·
|
obtain a license from the holder
of the intellectual property right alleged to have been infringed, which
license may not be available on reasonable terms, if at all;
and
|
|
|
·
|
redesign or, in the case of
trademark claims, rename our products or services to avoid infringing the
intellectual property rights of third parties, which may not be possible
and in any event could be costly and
time-consuming.
|
|
|
·
|
exposure
to unanticipated liabilities of an acquired company (or acquired
assets);
|
|
|
·
|
the
potential loss of key customers or key personnel in connection with, or as
the result of, a transaction;
|
|
|
·
|
the
recording of goodwill and intangible assets that will be subject to
impairment testing on a regular basis and potential periodic impairment
charges;
|
|
|
·
|
the
diversion of the attention of our management team from other business
concerns, including the day-to-day management of our Company and/or the
internal growth strategies that they are currently implementing;
and
|
|
|
·
|
the
risk of entering into markets or producing products where we have limited
or no experience, including the integration of the purchased technologies
and products with our technologies and
products.
|
|
|
·
|
rapid technological
change;
|
|
|
·
|
changes in advertiser and user
requirements and
preferences;
|
|
|
·
|
frequent new product and service
introductions embodying new technologies;
and
|
|
|
·
|
the emergence of new industry
standards and practices that could render our existing service offerings,
technology, and hardware and software infrastructure
obsolete.
|
|
|
·
|
enhance our existing services and
develop new services and technology that address the increasingly
sophisticated and varied needs of our prospective or current IAP
advertisers;
|
|
|
·
|
license, develop or acquire
technologies useful in our business on a timely basis;
and
|
|
|
·
|
respond to technological advances
and emerging industry standards and practices on a cost-effective and
timely basis.
|
|
|
·
|
decreased demand in the Internet
services sector;
|
|
|
·
|
variations in our operating
results;
|
|
|
·
|
announcements of technological
innovations or new services by us or our
competitors;
|
|
|
·
|
changes in expectations of our
future financial performance, including financial estimates by securities
analysts and investors;
|
|
|
·
|
our failure to meet analysts’
expectations;
|
|
|
·
|
changes in operating and stock
price performance of other technology companies similar to
us;
|
|
|
·
|
conditions or trends in the
technology industry;
|
|
|
·
|
additions or departures of key
personnel; and
|
|
|
·
|
future sales of our common
stock.
|
|
|
·
|
the authority of our board to
issue up to 5,000,000 shares of serial preferred stock and to
determine the price, rights, preferences, and privileges of these shares,
without stockholder
approval;
|
|
|
·
|
all stockholder actions must be
effected at a duly called meeting of stockholders and not by written
consent unless such action or proposal is first approved by our board of
directors;
|
|
|
·
|
special
meetings of the stockholders may be called only by the Chairman of the
Board, the Chief Executive Officer, or the President of our company;
and
|
|
|
·
|
cumulative voting is not allowed
in the election of our
directors.
|
|
Fiscal Year
|
Quarter Ended
|
High
|
Low
|
|||||||||
|
2008
|
December 31, 2007
|
$ | 7.00 | $ | 3.30 | |||||||
|
March 31, 2008
|
$ | 5.70 | $ | 3.18 | ||||||||
|
June 30, 2008
|
$ | 3.94 | $ | 2.35 | ||||||||
|
September 30, 2008
|
$ | 2.59 | $ | 1.40 | ||||||||
|
2009
|
December 31, 2008
|
$ | 2.00 | $ | 1.02 | |||||||
|
March 31, 2009
|
$ | 2.20 | $ | 1.24 | ||||||||
|
June 30, 2009
|
$ | 2.10 | $ | 1.00 | ||||||||
|
September 30, 2009
|
$ | 1.70 | $ | 1.01 | ||||||||
|
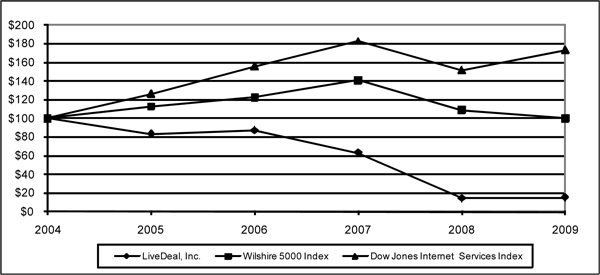
9/30/2004
|
9/30/2005
|
9/30/2006
|
9/30/2007
|
9/30/2008
|
9/30/2009
|
|||||||||||||||||||
|
LiveDeal,
Inc.
|
$ | 100.00 | $ | 83.06 | $ | 86.87 | $ | 63.10 | $ | 14.32 | $ | 15.27 | ||||||||||||
|
Wilshire
5000 Index
|
$ | 100.00 | $ | 112.79 | $ | 122.49 | $ | 140.99 | $ | 108.99 | $ | 100.15 | ||||||||||||
|
Dow
Jones Internet Services Index
|
$ | 100.00 | $ | 126.26 | $ | 155.70 | $ | 182.75 | $ | 151.33 | $ | 173.07 | ||||||||||||
|
|
§
|
Website
URL acquisition services whereby we obtain website address names on behalf
of our small business clients;
|
|
|
§
|
Website
development and deployment services where we create, house and manage
websites on behalf of our small business
clients;
|
|
|
§
|
Website
traffic and audience development services which provides sophisticated
search engine marketing techniques, access to our own websites,
partnerships with other websites and other techniques to generate traffic
to our customers’ websites, whether created and housed by us or
not;
|
|
|
§
|
Website
analytics and performance reports that generate information for our
customers about activities on their websites and lead activities for their
businesses based on Internet activities;
and
|
|
|
§
|
Directory
services whereby we provide both basic and enhanced directory listings for
our customers on our own directory and on partner
directories.
|
|
|
·
|
The
current effects of the recession and general economic
downturn;
|
|
|
·
|
Our
perception that the general economic downturn could lead our business
customers to seek lower-cost customer acquisition methods, primarily
through the Internet;
|
|
|
·
|
The
sale of our “www.yp.com” domain name in the first quarter of fiscal 2009,
which domain name was associated with our traditional
business;
|
|
|
·
|
The
reconstitution of our management team with additional capability in
Internet-based technologies;
|
|
|
·
|
The
termination of certain significant directory business contracts related to
the traditional business;
|
|
|
·
|
The
sale of certain of our traditional business assets including certain of
our customer lists; and
|
|
|
·
|
Continuing
losses in our classifieds
business.
|
|
|
·
|
Impairment
charges of $16,111,494 were recorded related to the write-down of our
goodwill and other intangible
assets;
|
|
|
·
|
We
commenced a plan to discontinue our classifieds business and initiated
shutdown activities;
|
|
|
·
|
We
sold our a customer list associated with its directory services business
and recorded a gain of $3,040,952;
and
|
|
|
·
|
We
established a valuation allowance of $10,586,854 related to our deferred
tax assets.
|
|
|
·
|
Rajeev
Seshadri replaced Gary Perschbacher as Chief Financial Officer effective
January 20, 2009; and
|
|
|
·
|
John
Raven submitted his resignation as President and Chief Operating Officer
effective February 15, 2009.
|
|
|
·
|
The
goodwill acquired in our acquisition of LiveDeal, Inc., the business focus
of which was online classified
advertising;
|
|
|
·
|
The
goodwill acquired in our acquisition of a Philippines call-center, OnCall
Subscriber Management, the business focus of which was providing
telemarketing services to acquire customers for our directory
services business;
|
|
|
·
|
Assets
related to our call-center operations and non-compete agreements that were
effectively made obsolete by the sale of a portion of our customer list
associated with our directory services business;
and
|
|
|
·
|
Intangible
assets related to our directory services business, including URLs,
internally developed software, and other miscellaneous intangible
assets.
|
|
Continuing
Operations
|
Discontinued
Operations
|
Total
Impairment
|
||||||||||
|
Goodwill
|
$ | 4,350,041 | $ | 7,356,365 | $ | 11,706,406 | ||||||
|
Domain
name and marketing related intangibles
|
1,879,054 | - | 1,879,054 | |||||||||
|
Assets
related to customer list
|
1,259,680 | - | 1,259,680 | |||||||||
|
Website
and technology related intangibles
|
377,334 | 889,020 | 1,266,354 | |||||||||
| $ | 7,866,109 | $ | 8,245,385 | $ | 16,111,494 | |||||||
|
|
·
|
Fulfillment
and Marketing Agreement dated October 10, 2007, by and between the Company
and Sharednet.
|
|
|
·
|
Fulfillment
and Marketing Agreement dated October 16, 2007, by and between the Company
and OneSource Web Hosting.
|
|
|
·
|
Fulfillment
and Marketing Agreement dated October 10,2007, by and between the Company
and Blabb1e Networks.
|
|
Year Ended
September 30,
|
Net
Revenues
|
Change from
Prior Year
|
Percent Change
from Prior Year
|
||||||||||
|
2009
|
$ | 13,438,655 | $ | (9,982,003 | ) | (42.6 | )% | ||||||
|
2008
|
$ | 23,420,658 | |||||||||||
|
Year Ended
September 30,
|
Cost of
Services
|
Change from
Prior Year
|
Percent Change
from Prior Year
|
||||||||||
|
2009
|
$ | 6,391,778 | $ | 2,050,524 | 47.2 | % | |||||||
|
2008
|
$ | 4,341,254 | |||||||||||
|
Year Ended
September 30,
|
Gross
Profit
|
Change from
Prior Year
|
Percent Change
from Prior Year
|
||||||||||
|
2009
|
$ | 7,046,877 | $ | (12,032,527 | ) | (63.1 | )% | ||||||
|
2008
|
$ | 19,079,404 | |||||||||||
|
Year ended September 30,
|
||||||||
|
2009
|
2008
|
|||||||
|
Customer
acquisition services -
|
||||||||
|
Gross
profit
|
$ | 1,339,997 | $ | 93,759 | ||||
|
Gross
margin
|
32.6 | % | 14.6 | % | ||||
|
Directory
services -
|
||||||||
|
Gross
profit
|
$ | 5,706,880 | $ | 18,985,644 | ||||
|
Gross
margin
|
61.2 | % | 83.3 | % | ||||
|
Year Ended
September 30,
|
General &
Administrative
Expenses
|
Change from
Prior Year
|
Percent Change
from Prior Year
|
||||||||||
|
2009
|
$ | 15,179,981 | $ | (415,190 | ) | (2.7 | )% | ||||||
|
2008
|
$ | 15,595,171 | |||||||||||
|
|
·
|
A
decrease in depreciation and amortization expense of approximately
$542,000 due primarily to the effects of the impairment of depreciable
intangible assets that occurred in the second quarter of fiscal
2009;
|
|
|
·
|
A
decrease in investor relations expenses of approximately $245,000 stemming
from cost containment initiatives;
|
|
|
·
|
A
decrease in customer related expenses of approximately $106,000 due to the
decline in business activities associated with our directory services
business as a result of our change in business
strategy;
|
|
|
·
|
A
decrease in rent and office expenses of approximately $234,000 as a result
of the closure of our Santa Clara facility and other cost-containment
initiatives;
|
|
|
·
|
A
decrease in compensation expense of approximately $20,000 which was
comprised of a decrease of $915,000 of stock based compensation resulting
from the effects of true-ups of our estimated forfeiture rate and a
reduction in the use of stock awards as part of our compensation,
partially offset by an increase of $895,000 of compensation, payroll and
benefits expenses associated with additional staffing in sales and
technology development to support our change in business
strategy;
|
|
|
·
|
A
decrease of other G&A expenses of approximately $118,000, partially
offset by
|
|
|
·
|
An
increase in software expense of approximately $427,000 representing
non-capitalizable costs associated with our new product offerings in our
customer acquisition services
segment;
|
|
|
·
|
An
increase in professional and consulting fees of approximately $423,000
attributable to legal costs incurred to defend the Company against certain
claims in fiscal 2009.
|
| Q4 2009 | Q3 2009 | Q2 2009 | Q1 2009 | Q4 2008 | Q3 2008 | Q2 2008 | Q1 2008 | |||||||||||||||||||||||||
|
Compensation
for employees, leased employees, officers and directors
|
$ | 2,054,709 | $ | 2,392,081 | $ | 2,311,056 | $ | 2,508,835 | $ | 1,810,383 | $ | 3,181,375 | $ | 2,377,412 | $ | 1,928,272 | ||||||||||||||||
|
Professional
fees
|
336,273 | 421,700 | 411,564 | 455,832 | 456,180 | 275,638 | 191,330 | 281,418 | ||||||||||||||||||||||||
|
Depreciation
and amortization
|
211,336 | 186,077 | 560,383 | 559,289 | 588,718 | 505,095 | 487,085 | 478,433 | ||||||||||||||||||||||||
|
Other
general and administrative costs
|
451,300 | 813,124 | 771,352 | 735,070 | 707,665 | 845,351 | 789,318 | 706,848 |
|
Year Ended
September 30,
|
Sales &
Marketing
Expenses
|
Change from
Prior Year
|
Percent Change
from Prior Year
|
||||||||||
|
2009
|
$ | 2,457,063 | $ | (2,777,086 | ) | (53.1 | )% | ||||||
|
2008
|
$ | 5,234,149 | |||||||||||
|
|
·
|
$2,980,000
of decreased telemarketing and other customer acquisition costs as we
began transitioning away from marketing activities geared toward our
directory services business; and
|
|
|
·
|
$252,000
of reduced branding, online advertising and other sales and marketing
expenses; partially offset by
|
|
|
·
|
$455,000
of increased expenditures for click traffic that we believe is more cost
effective than online advertising.
|
|
Year Ended
September 30,
|
Impairment of
Goodwill and Intangible
Assets
|
Change from
Prior Year
|
Percent Change
from Prior Year
|
||||||||||
|
2009
|
$ | 7,866,109 | $ | 7,866,109 | n/a | ||||||||
|
2008
|
$ | - | |||||||||||
|
Year Ended
September 30,
|
Operating
Loss
|
Change from
Prior Year
|
Percent Change
from Prior Year
|
||||||||||
|
2009
|
$ | (18,456,276 | ) | $ | (16,706,360 | ) | 954.7 | % | |||||
|
2008
|
$ | (1,749,916 | ) | ||||||||||
|
Year Ended
September 30,
|
Total Other Income
(Expense)
|
Change from
Prior Year
|
Percent Change
from Prior Year
|
||||||||||
|
2009
|
$ | 7,527,934 | $ | 7,405,544 | 6050.8 | % | |||||||
|
2008
|
$ | 122,390 | |||||||||||
|
Year
Ended
September
30,
|
Income
Tax
Provision
(Benefit)
|
Change
from
Prior
Year
|
Percent
Change
from
Prior Year
|
|||||||||
|
2009
|
$ | 3,393,515 | $ | 3,548,230 | 2293.4 | % | ||||||
|
2008
|
$ | (154,715 | ) | |||||||||
|
Year
Ended
September
30,
|
Loss
from
Discontinued
Operations
|
Change
from
Prior
Year
|
Percent
Change
from
Prior Year
|
|||||||||
|
2009
|
$ | (8,269,443 | ) | $ | (8,213,482 | ) | 14677.2 | % | ||||
|
2008
|
$ | (55,961 | ) | |||||||||
|
Year
Ended
September
30,
|
Net
Loss
|
Change
from
Prior
Year
|
Percent
Change
from
Prior Year
|
|||||||||
|
2009
|
$ | (22,591,300 | ) | $ | (21,062,528 | ) | 1377.7 | % | ||||
|
2008
|
$ | (1,528,772 | ) | |||||||||
|
Payments
Due by Fiscal Year
|
||||||||||||||||||||||||||||
|
Total
|
2010
|
2011
|
2012
|
2013
|
2014
|
Thereafter
|
||||||||||||||||||||||
|
Operating
lease commitments
|
$ | 1,315,693 | $ | 497,117 | $ | 424,525 | $ | 315,331 | $ | 78,720 | $ | - | $ | - | ||||||||||||||
|
Capital
lease commitments
|
198,644 | 76,876 | 76,876 | 44,892 | - | - | - | |||||||||||||||||||||
|
Noncanceleable
service contracts
|
1,029,362 | 647,251 | 361,111 | 21,000 | - | - | - | |||||||||||||||||||||
| $ | 2,543,699 | $ | 1,221,244 | $ | 862,512 | $ | 381,223 | $ | 78,720 | $ | - | $ | - | |||||||||||||||
|
Page
|
||
|
33
|
||
|
Consolidated
Financial Statements:
|
||
|
34
|
||
|
35
|
||
|
36
|
||
|
37
|
||
|
38
|
||
|
September
30,
|
||||||||
|
2009
|
2008
|
|||||||
|
(as
restated,
|
||||||||
|
see
Note 3)
|
||||||||
|
Assets
|
||||||||
|
Cash
and cash equivalents
|
$ | 7,568,030 | $ | 4,639,787 | ||||
|
Certificates
of deposit
|
100,000 | - | ||||||
|
Accounts
receivable, net
|
1,478,183 | 6,326,272 | ||||||
|
Prepaid
expenses and other current assets
|
326,442 | 792,309 | ||||||
|
Customer
acquisition costs, net
|
- | 642,220 | ||||||
|
Income
taxes receivable
|
1,490,835 | 487,532 | ||||||
|
Deferred
tax asset, net of valuation allowance
|
- | 949,121 | ||||||
|
Total
current assets
|
10,963,490 | 13,837,241 | ||||||
|
Accounts
receivable, long term portion, net
|
1,039,403 | 2,011,143 | ||||||
|
Property
and equipment, net
|
615,906 | 959,854 | ||||||
|
Deposits
and other assets
|
81,212 | 83,547 | ||||||
|
Intangible
assets, net
|
2,336,714 | 6,736,078 | ||||||
|
Goodwill
|
- | 11,706,406 | ||||||
|
Deferred
tax asset, long term, net of valuation allowance
|
- | 3,863,502 | ||||||
|
Total
assets
|
$ | 15,036,725 | $ | 39,197,771 | ||||
|
Liabilities
and Stockholders' Equity
|
||||||||
|
Liabilities:
|
||||||||
|
Accounts
payable
|
$ | 549,681 | $ | 1,078,712 | ||||
|
Accrued
liabilities
|
1,092,811 | 1,437,149 | ||||||
|
Current
portion of capital lease obligation
|
69,612 | 61,149 | ||||||
|
Total
current liabilities
|
1,712,104 | 2,577,010 | ||||||
|
Long
term portion of capital lease obligation
|
117,073 | 170,838 | ||||||
|
Total
liabilities
|
1,829,177 | 2,747,848 | ||||||
|
Commitments
and contingencies
|
||||||||
|
Stockholders'
equity:
|
||||||||
|
Series
E convertible preferred stock, $0.001 par value, 200,000 shares
authorized,
|
||||||||
|
127,840
issued and outstanding, liquidation preference $38,202
|
10,866 | 10,866 | ||||||
|
Common
stock, $0.001 par value, 100,000,000 shares authorized, 6,133,433 issued
and
|
||||||||
|
6,104,327
outstanding at September 30, 2009 and 6,513,687 issued and
|
||||||||
|
outstanding
at September 30, 2008
|
6,133 | 6,514 | ||||||
|
Treasury
stock (29,106 and 0 shares carried at cost) at September 30, 2009
and
|
(45,041 | ) | - | |||||
|
2008,
respectively
|
||||||||
|
Paid
in capital
|
20,280,377 | 20,884,112 | ||||||
|
Retained
earnings (accumulated deficit)
|
(7,044,787 | ) | 15,548,431 | |||||
|
Total
stockholders' equity
|
13,207,548 | 36,449,923 | ||||||
|
Total
liabilities and stockholders' equity
|
$ | 15,036,725 | $ | 39,197,771 | ||||
|
Year
ended September 30,
|
||||||||
|
2009
|
2008
|
|||||||
|
Net
revenues
|
$ | 13,438,655 | $ | 23,420,658 | ||||
|
Cost
of services
|
6,391,778 | 4,341,254 | ||||||
|
Gross
profit
|
7,046,877 | 19,079,404 | ||||||
|
Operating
expenses:
|
||||||||
|
General
and administrative expenses
|
15,179,981 | 15,595,171 | ||||||
|
Impairment
of goodwill
|
4,350,041 | - | ||||||
|
Impairment
of intangible assets
|
3,516,068 | - | ||||||
|
Sales
and marketing expenses
|
2,457,063 | 5,234,149 | ||||||
|
Total
operating expenses
|
25,503,153 | 20,829,320 | ||||||
|
Operating
loss
|
(18,456,276 | ) | (1,749,916 | ) | ||||
|
Other
income (expense):
|
||||||||
|
Interest
income, net
|
37,686 | 134,694 | ||||||
|
Other
income (expense)
|
7,490,248 | (12,304 | ) | |||||
|
Total
other income (expense)
|
7,527,934 | 122,390 | ||||||
|
Loss
before income taxes
|
(10,928,342 | ) | (1,627,526 | ) | ||||
|
Income
tax provision (benefit)
|
3,393,515 | (154,715 | ) | |||||
|
Loss
from continuing operations
|
(14,321,857 | ) | (1,472,811 | ) | ||||
|
Discontinued
operations
|
||||||||
|
Loss
from discontinued component, including disposal costs
|
(8,329,470 | ) | (89,337 | ) | ||||
|
Income
tax benefit
|
(60,027 | ) | (33,376 | ) | ||||
|
Loss
from discontinued operations
|
(8,269,443 | ) | (55,961 | ) | ||||
|
Net
loss
|
$ | (22,591,300 | ) | $ | (1,528,772 | ) | ||
|
Earnings
per share - Basic:
|
||||||||
|
Loss
from continuing operations
|
$ | (2.38 | ) | $ | (0.24 | ) | ||
|
Discontinued
operations
|
(1.38 | ) | (0.01 | ) | ||||
|
Net
loss
|
$ | (3.76 | ) | $ | (0.25 | ) | ||
|
Earnings
per share - Diluted:
|
||||||||
|
Loss
from continuing operations
|
$ | (2.38 | ) | $ | (0.24 | ) | ||
|
Discontinued
operations
|
(1.38 | ) | (0.01 | ) | ||||
|
Net
loss
|
$ | (3.76 | ) | $ | (0.25 | ) | ||
|
Weighted
average common shares outstanding:
|
||||||||
|
Basic
|
6,005,664 | 6,231,610 | ||||||
|
Diluted
|
6,005,664 | 6,231,610 | ||||||
|
|
Common
Stock
|
Preferred
Stock
|
Treasury
|
Paid-In
|
Retained
|
|||||||||||||||||||||||||||
|
Shares
|
Amount
|
Shares
|
Amount
|
Stock
|
Capital
|
Earnings
|
Total
|
|||||||||||||||||||||||||
|
Balance,
September 30, 2007
|
6,693,676 | $ | 6,694 | 127,840 | $ | 10,866 | $ | (2,714,698 | ) | $ | 23,325,888 | $ | 17,079,121 | $ | 37,707,871 | |||||||||||||||||
|
Series
E preferred stock dividends
|
- | - | - | - | - | - | (1,918 | ) | (1,918 | ) | ||||||||||||||||||||||
|
Common
stock issued in restricted stock plan
|
53,000 | 53 | - | - | - | (53 | ) | - | - | |||||||||||||||||||||||
|
Stock
based compensation - stock options
|
- | - | - | - | - | 10,155 | - | 10,155 | ||||||||||||||||||||||||
|
Restricted
stock cancellations
|
(84,169 | ) | (84 | ) | - | - | - | 84 | - | - | ||||||||||||||||||||||
|
Amortization
of deferred stock compensation
|
- | - | - | - | - | 788,431 | - | 788,431 | ||||||||||||||||||||||||
|
Treasury
stock purchases
|
(148,820 | ) | (149 | ) | - | - | (525,844 | ) | 149 | - | (525,844 | ) | ||||||||||||||||||||
|
Treasury
stock retired
|
- | - | - | - | 3,240,542 | (3,240,542 | ) | - | - | |||||||||||||||||||||||
|
Net
income (loss)
|
- | - | - | - | - | - | (1,528,772 | ) | (1,528,772 | ) | ||||||||||||||||||||||
|
Balance,
September 30, 2008
|
6,513,687 | 6,514 | 127,840 | 10,866 | - | 20,884,112 | 15,548,431 | 36,449,923 | ||||||||||||||||||||||||
|
Series
E preferred stock dividends
|
- | - | - | - | - | - | (1,918 | ) | (1,918 | ) | ||||||||||||||||||||||
|
Common
stock issued in restricted stock plan
|
20,000 | 20 | - | - | - | (20 | ) | - | - | |||||||||||||||||||||||
|
Stock
based compensation - stock options
|
- | - | - | - | - | 82,036 | - | 82,036 | ||||||||||||||||||||||||
|
Restricted
stock cancellations
|
(83,250 | ) | (84 | ) | - | - | - | 84 | - | - | ||||||||||||||||||||||
|
Amortization
of deferred stock compensation
|
- | - | - | - | - | (198,672 | ) | - | (198,672 | ) | ||||||||||||||||||||||
|
Treasury
stock purchases
|
- | - | - | - | (532,521 | ) | - | - | (532,521 | ) | ||||||||||||||||||||||
|
Treasury
stock retired
|
(317,004 | ) | (317 | ) | - | - | 487,480 | (487,163 | ) | - | - | |||||||||||||||||||||
|
Net
income (loss)
|
- | - | - | - | - | - | (22,591,300 | ) | (22,591,300 | ) | ||||||||||||||||||||||
|
Balance,
September 30, 2009
|
6,133,433 | $ | 6,133 | 127,840 | $ | 10,866 | $ | (45,041 | ) | $ | 20,280,377 | $ | (7,044,787 | ) | $ | 13,207,548 | ||||||||||||||||
|
Year
ended September 30,
|
||||||||
|
2009
|
2008
|
|||||||
|
CASH
FLOWS FROM OPERATING ACTIVITIES:
|
||||||||
|
Net
loss
|
$ | (22,591,300 | ) | $ | (1,528,772 | ) | ||
|
Adjustments
to reconcile net loss to net cash
|
||||||||
|
provided
by (used in) operating activities:
|
||||||||
|
Depreciation
and amortization
|
2,297,626 | 3,191,237 | ||||||
|
Non-cash
stock compensation expense
|
82,036 | 10,155 | ||||||
|
Amortization
of stock-based compensation
|
(198,672 | ) | 788,431 | |||||
|
Deferred
income taxes
|
4,812,623 | 285,166 | ||||||
|
Provision
for uncollectible accounts
|
2,703,067 | 505,812 | ||||||
|
Noncash
impairment of goodwill and other intangibles
|
16,111,494 | - | ||||||
|
Gain
on sale of customer list
|
(3,040,952 | ) | - | |||||
|
Gain
on sale of internet domain name
|
(3,805,778 | ) | - | |||||
|
Gain
on amendment of directory services contract
|
(642,268 | ) | - | |||||
|
(Gain)
loss on disposal of equipment
|
36,693 | 15,352 | ||||||
|
Changes
in assets and liabilities:
|
||||||||
|
Accounts
receivable
|
3,116,762 | 17,949 | ||||||
|
Customer
acquisition costs
|
- | (1,700,000 | ) | |||||
|
Prepaid
and other current assets
|
10,352 | (281,700 | ) | |||||
|
Deposits
and other assets
|
2,335 | 19,510 | ||||||
|
Accounts
payable
|
(529,031 | ) | (59,553 | ) | ||||
|
Accrued
liabilities
|
(324,867 | ) | 238,901 | |||||
|
Income
taxes receivable
|
(1,003,303 | ) | (171,103 | ) | ||||
|
Net
cash provided by (used in) operating activities
|
(2,963,183 | ) | 1,331,385 | |||||
|
CASH
FLOWS FROM INVESTING ACTIVITIES:
|
||||||||
|
Proceeds
from sale of internet domain name
|
3,850,000 | - | ||||||
|
Proceeds
from sale of customer list
|
2,937,501 | - | ||||||
|
Proceeds
from amendment of directory services contract
|
642,268 | - | ||||||
|
Expenditures
for intangible assets
|
(734,878 | ) | (1,227,334 | ) | ||||
|
Investment
in certificates of deposits
|
(100,000 | ) | - | |||||
|
Purchases
of equipment
|
(100,821 | ) | (589,338 | ) | ||||
|
Net
cash provided by (used in) investing activities
|
6,494,070 | (1,816,672 | ) | |||||
|
CASH
FLOWS FROM FINANCING ACTIVITIES:
|
||||||||
|
Principal
repayments on capital lease obligations
|
(70,123 | ) | (23,615 | ) | ||||
|
Purchase
of treasury stock
|
(532,521 | ) | (525,844 | ) | ||||
|
Net
cash used in financing activities
|
(602,644 | ) | (549,459 | ) | ||||
|
INCREASE
(DECREASE) IN CASH AND CASH EQUIVALENTS
|
2,928,243 | (1,034,746 | ) | |||||
|
CASH
AND CASH EQUIVALENTS, beginning of year
|
4,639,787 | 5,674,533 | ||||||
|
CASH
AND CASH EQUIVALENTS, end of year
|
$ | 7,568,030 | $ | 4,639,787 | ||||
|
Supplemental
cash flow disclosures:
|
||||||||
|
Cash
paid for interest
|
$ | - | $ | 3,586 | ||||
|
Cash
paid for income taxes
|
$ | 1,860 | $ | 1,860 | ||||
|
Noncash
financing and investing activities:
|
||||||||
|
Acquistion
of equipment under capital leases
|
$ | 24,821 | $ | 255,602 | ||||
|
Accrued
and unpaid dividends
|
$ | 1,918 | $ | 1,918 | ||||
|
ORGANIZATION AND BASIS OF
PRESENTATION
|
|
|
1. The
current effects of the recession and general economic
downturn;
|
|
|
2.
|
Management’s
perception that the general economic downturn could lead the Company’s
business customers to seek lower-cost customer acquisition methods,
primarily through the Internet;
|
|
3.
|
The
sale of the Company’s “www.yp.com” domain name in the first quarter of
2009, which domain name was associated with the Company’s traditional
business;
|
|
|
4.
The reconstitution of the Company’s management team with additional
capability in Internet-based
technologies;
|
|
|
5.
The termination of certain significant directory business contracts
related to the traditional
business;
|
|
|
6.
The sale of certain of the Company’s traditional business assets,
including certain of its customer lists;
and
|
|
7.
|
Continuing
losses in the Company’s classifieds
business
|
|
|
1.
|
Impairment
charges of $16,111,494 were recorded related to the write-down of the
Company’s goodwill and other intangible assets as discussed in Note
5;
|
|
|
2.
|
The
Company commenced a plan to discontinue its classifieds business and
initiated shutdown activities, as discussed in Note 6, and has reflected
the operating results of this line of business as discontinued operations
in the accompanying consolidated statements of
operations;
|
|
|
3.
|
The
Company sold a portion of its customer list associated with its directory
services business and recorded a gain of $3,040,952, as discussed in Note
15; and
|
|
|
4.
|
The
Company established a valuation allowance of $10,586,854 related to its
deferred tax assets, as described in Note
11.
|
|
|
·
|
Telco Billing, Inc. was formed in
April 1998 to provide advertising and directory listings for businesses on
its Internet website in a “Yellow Pages” format. Telco provides
those services to its subscribers for a monthly fee. These
services are provided primarily to businesses throughout the United
States. Telco became a wholly owned subsidiary of YP Corp.
after the June 1999
acquisition.
|
|
|
·
|
At the time that the transaction
was agreed to, the Company had 12,567,770 common shares issued and
outstanding. As a result of the merger transaction with Telco,
there were 29,567,770 common shares outstanding, and the former Telco
stockholders held approximately 57% of the Company’s voting
stock. For financial accounting purposes, the acquisition was a
reverse acquisition of the Company by Telco, under the purchase method of
accounting, and was treated as a recapitalization with Telco as the
acquirer. Consistent with reverse acquisition accounting, (i)
all of Telco’s assets, liabilities, and accumulated deficit were reflected
at their combined historical cost (as the accounting acquirer) and (ii)
the preexisting outstanding shares of the Company (the accounting
acquiree) were reflected at their net asset value as if issued on June 16,
1999.
|
|
|
·
|
On June 6, 2007, the Company
completed its acquisition of LiveDeal, Inc. (“LiveDeal”), a California
corporation. LiveDeal operated an online local classifieds
marketplace, www.livedeal.com, which listed millions of goods and services
for sale across the United States. The technology acquired in
the acquisition offered such classifieds functionality as fraud
protection, identity protection, e-commerce, listing enhancements, photos,
community-building, package pricing, premium stores, featured Yellow Page
business listings and advanced local search capabilities. This
business has since been discontinued – see Note
6.
|
|
|
·
|
On July 10, 2007, the Company
acquired substantially all of the assets and assumed certain liabilities
of OnCall Subscriber Management Inc., a Manila, Philippines-based company
that provided telemarketing services. The acquisition took
place through the Company’s wholly-owned subsidiary, 247 Marketing LLC, a
Nevada limited liability
company.
|
|
|
·
|
On August 10, 2007, the Company
filed amended and restated articles of incorporation with the Office of
the Secretary of State of the State of Nevada, pursuant to which the
Company’s name was changed to LiveDeal, Inc., effective August 15,
2007. The name change was approved by the Company’s Board of
Directors pursuant to discretion granted to it by the Company’s
stockholders at a special meeting on August 2,
2007.
|
|
2.
|
SUMMARY OF SIGNIFICANT ACCOUNTING
POLICIES
|
|
•
|
direct
ACH withdrawals; and
|
|
•
|
inclusion
on the customer’s local telephone bill provided by their Local Exchange
Carriers, or LECs.
|
|
3.
|
RESTATEMENT
|
|
September 30, 2008
|
||||||||||||
|
As
Originally
Reported
|
As Restated
|
Net Change
|
||||||||||
|
Accounts
receivable, net (current)
|
$ | 6,880,492 | $ | 6,326,272 | $ | (554,220 | ) | |||||
|
Accrued
liabilities
|
$ | 1,991,369 | $ | 1,437,149 | $ | (554,220 | ) | |||||
|
4.
|
BALANCE SHEET
INFORMATION
|
|
|
September
30,
|
September
30,
|
||||||
|
2009
|
2008
|
|||||||
|
(as
restated,
|
||||||||
|
see
Note 3)
|
||||||||
|
Receivables,
current, net:
|
||||||||
|
Accounts
receivable, current
|
$ | 3,776,966 | $ | 8,369,095 | ||||
|
Less:
Allowance for doubtful accounts
|
(2,298,783 | ) | (2,042,823 | ) | ||||
| $ | 1,478,183 | $ | 6,326,272 | |||||
|
Receivables,
long term, net:
|
||||||||
|
Accounts
receivable, long term
|
$ | 1,581,946 | $ | 2,171,865 | ||||
|
Less:
Allowance for doubtful accounts
|
(542,543 | ) | (160,722 | ) | ||||
| $ | 1,039,403 | $ | 2,011,143 | |||||
|
Total
receivables, net:
|
||||||||
|
Gross
receivables
|
$ | 5,358,912 | $ | 10,540,960 | ||||
|
Allowance
for doubtful accounts
|
(2,841,326 | ) | (2,203,545 | ) | ||||
| $ | 2,517,586 | $ | 8,337,415 | |||||
|
September
30,
|
September
30,
|
|||||||
|
2009
|
2008
|
|||||||
|
Allowance
for dilution and fees on amounts due
from billing aggregators
|
$ | 2,690,895 | $ | 1,775,276 | ||||
|
Allowance
for customer refunds
|
150,431 | 428,269 | ||||||
| $ | 2,841,326 | $ | 2,203,545 | |||||
|
September
30,
|
September
30,
|
|||||||
|
2009
|
2008
|
|||||||
|
Property
and equipment, net:
|
||||||||
|
Leasehold
improvements
|
$ | 235,056 | $ | 233,970 | ||||
|
Furnishings
and fixtures
|
336,067 | 311,319 | ||||||
|
Office,
computer equipment and other
|
692,317 | 961,931 | ||||||
| 1,263,440 | 1,507,220 | |||||||
|
Less:
Accumulated depreciation
|
(647,534 | ) | (547,366 | ) | ||||
| $ | 615,906 | $ | 959,854 | |||||
|
September
30,
|
September
30,
|
|||||||
|
2009
|
2008
|
|||||||
|
Intangible
assets, net:
|
||||||||
|
Domain
name and marketing related intangibles
|
$ | 6,699,600 | $ | 7,208,600 | ||||
|
Non-compete
agreements
|
3,465,000 | 3,465,000 | ||||||
|
Website
and technology related intangibles
|
4,678,970 | 4,147,459 | ||||||
| 14,843,570 | 14,821,059 | |||||||
|
Less: Accumulated
amortization
|
(12,506,856 | ) | (8,084,981 | ) | ||||
| $ | 2,336,714 | $ | 6,736,078 | |||||
|
|
September
30,
|
September
30,
|
||||||
|
2009
|
2008
|
|||||||
|
(as
restated,
|
||||||||
|
see
Note 3)
|
||||||||
|
Accrued
liabilities:
|
||||||||
|
Deferred
revenue
|
$ | 148,916 | $ | 362,848 | ||||
|
Accrued
payroll and bonuses
|
289,944 | 306,984 | ||||||
|
Accruals
under revenue sharing agreements
|
314,754 | 326,306 | ||||||
|
Accrued
expenses - other
|
339,197 | 441,011 | ||||||
| $ | 1,092,811 | $ | 1,437,149 | |||||
|
September
30,
|
September
30,
|
|||||||
|
2009
|
2008
|
|||||||
|
Customer
acquisition costs, net:
|
||||||||
|
Customer
acquisition costs
|
$ | 1,700,000 | $ | 1,700,000 | ||||
|
Less: Accumulated
amortization
|
(1,700,000 | ) | (1,057,780 | ) | ||||
| $ | - | $ | 642,220 | |||||
|
5.
|
INTANGIBLE
ASSETS
|
|
|
1.
|
The
goodwill acquired by the Company in its acquisition of LiveDeal, Inc., the
business focus of which was online classified advertising which was
originally intended to be merged with the Company’s existing directory
services business;
|
|
|
2.
|
The
goodwill acquired by the Company in its acquisition of a Philippines
call-center, OnCall Subscriber Management, the business focus of
which was providing telemarketing services to acquire customers for
its directory services business;
|
|
|
3.
|
Assets
related to the Company’s call-center operations and non-compete agreements
that were effectively made obsolete due to the sale of a portion of the
Company’s customer list associated with its directory services business,
as described in Note 15; and
|
|
|
4.
|
Intangible
assets related to the Company’s directory services business, including
URLs, internally developed software, and other miscellaneous intangible
assets.
|
|
Continuing
Operations
|
Discontinued
Operations
|
Total
Impairment
|
||||||||||
|
Goodwill
|
$ | 4,350,041 | $ | 7,356,365 | $ | 11,706,406 | ||||||
|
Domain
name and marketing related intangibles
|
1,879,054 | 1,879,054 | ||||||||||
|
Assets
related to customer list
|
1,259,680 | - | 1,259,680 | |||||||||
|
Website
and technology related intangibles
|
377,334 | 889,020 | 1,266,354 | |||||||||
| $ | 7,866,109 | $ | 8,245,385 | $ | 16,111,494 | |||||||
|
Years
ended September 30,
|
||||
|
2010
|
$ | 581,996 | ||
|
2011
|
432,895 | |||
|
2012
|
210,557 | |||
|
2013
|
77,422 | |||
|
2014
|
77,422 | |||
|
Thereafter
|
956,422 | |||
|
Total
|
$ | 2,336,714 | ||
|
6.
|
DISCONTINUED
OPERATIONS
|
|
7.
|
CAPITAL
LEASES
|
|
2010
|
$ | 76,876 | ||
|
2011
|
76,876 | |||
|
2012
|
44,892 | |||
|
2013
|
- | |||
|
2014
|
- | |||
|
Thereafter
|
- | |||
|
Total
minimum lease payments
|
198,644 | |||
|
Less
imputed interest
|
(11,959 | ) | ||
|
Present
value of minimum lease payments
|
186,685 | |||
|
Less:
current maturities of capital lease obligations
|
69,612 | |||
|
Noncurrent
maturities of capital lease obligations
|
$ | 117,073 |
|
8.
|
STOCKHOLDERS’
EQUITY
|
|
9.
|
NET LOSS PER
SHARE
|
|
Year Ended
September 30, 2009 |
Year Ended
September 30, 2008 |
|||||||
|
Net
loss from continuing operations
|
$ | (14,321,857 | ) | $ | (1,472,811 | ) | ||
|
Less:
preferred stock dividends
|
(1,918 | ) | (1,918 | ) | ||||
|
Loss
from continuing operations
|
||||||||
|
applicable
to common stock
|
(14,323,775 | ) | (1,474,729 | ) | ||||
|
Loss
from discontinued operations
|
(8,269,443 | ) | (55,961 | ) | ||||
|
Net
loss applicable to common stock
|
$ | (22,593,218 | ) | $ | (1,530,690 | ) | ||
|
Basic
weighted average common shares outstanding:
|
6,005,664 | 6,231,610 | ||||||
|
Add
incremental shares for:
|
||||||||
|
Unvested
restricted stock
|
- | - | ||||||
|
Series
E convertible preferred stock
|
- | - | ||||||
|
Outstanding
warrants
|
- | - | ||||||
|
Diluted
weighted average common shares outstanding:
|
6,005,664 | 6,231,610 | ||||||
|
Earnings
per share - Basic:
|
||||||||
|
Loss
from continuing operations
|
$ | (2.38 | ) | $ | (0.24 | ) | ||
|
Discontinued
operations
|
(1.38 | ) | (0.01 | ) | ||||
|
Net
loss
|
$ | (3.76 | ) | $ | (0.25 | ) | ||
|
Earnings
per share - Diluted:
|
||||||||
|
Loss
from continuing operations
|
$ | (2.38 | ) | $ | (0.24 | ) | ||
|
Discontinued
operations
|
(1.38 | ) | (0.01 | ) | ||||
|
Net
loss
|
$ | (3.76 | ) | $ | (0.25 | ) | ||
|
September 30,
|
||||||||
|
2009
|
2008
|
|||||||
|
Options
to purchase shares of common stock
|
403,032 | 5,000 | ||||||
|
Series
E convertible preferred stock
|
127,840 | 127,840 | ||||||
|
Shares
of non-vested restricted stock
|
152,169 | 322,614 | ||||||
| 683,041 | 455,454 | |||||||
|
10.
|
COMMITMENTS
AND CONTINGENCIES
|
|
Payments Due by Fiscal Year
|
||||||||||||||||||||||||||||
|
Total
|
2010
|
2011
|
2012
|
2013
|
2014
|
Thereafter
|
||||||||||||||||||||||
|
Operating
lease commitments
|
$ | 1,315,693 | $ | 497,117 | $ | 424,525 | $ | 315,331 | $ | 78,720 | $ | - | $ | - | ||||||||||||||
|
Noncanceleable
service contracts
|
1,029,362 | 647,251 | 361,111 | 21,000 | - | - | - | |||||||||||||||||||||
| $ | 2,345,055 | $ | 1,144,368 | $ | 785,636 | $ | 336,331 | $ | 78,720 | $ | - | $ | - | |||||||||||||||
|
|
·
|
Fulfillment
and Marketing Agreement dated October 10, 2007, by and between
the Company and Sharednet.
|
|
|
·
|
Fulfillment
and Marketing Agreement dated October 16, 2007, by and between
the Company and OneSource Web
Hosting.
|
|
|
·
|
Fulfillment
and Marketing Agreement dated October 10, 2007, by and between
the Company and Blabb1e
Networks.
|
|
11.
|
PROVISION
FOR INCOME TAXES
|
|
2009
|
2008
|
|||||||
|
Current
provision (benefit)
|
$ | (1,071,763 | ) | $ | (470,728 | ) | ||
|
Deferred
(benefit) provision
|
4,405,251 | 282,637 | ||||||
|
Net
income tax (benefit) provision
|
$ | 3,333,488 | $ | (188,091 | ) | |||
|
2009
|
2008
|
|||||||||||||||
|
Amount
|
Percent
|
Amount
|
Percent
|
|||||||||||||
|
Federal
statutory rates
|
$ | (6,547,656 | ) | 381 | % | $ | (583,733 | ) | (16 | )% | ||||||
|
State
income taxes
|
(647,294 | ) | 38 | % | (57,707 | ) | (2 | )% | ||||||||
|
Write
off of deferred tax asset
|
||||||||||||||||
|
related
to vested restricted stock
|
48,570 | (3 | )% | 517,547 | 14 | % | ||||||||||
|
Valuation
allowance against net
|
||||||||||||||||
|
deferred
tax assets
|
10,586,854 | |||||||||||||||
|
Other
|
(106,986 | ) | 6 | % | (64,198 | ) | (2 | )% | ||||||||
|
Effective
rate
|
$ | 3,333,488 | (194 | )% | $ | (188,091 | ) | (5 | )% | |||||||
|
2009
|
2008
|
|||||||
|
Deferred
income tax asset, current:
|
||||||||
|
Book
to tax differences in accounts receivable
|
$ | 1,118,416 | $ | 884,368 | ||||
|
Book
to tax differences in prepaid assets andaccrued expenses
|
(34,829 | ) | 64,753 | |||||
|
Total
deferred income tax asset, current
|
1,083,587 | 949,121 | ||||||
|
Less:
valuation allowance
|
(1,083,587 | ) | - | |||||
|
Deferred
income tax asset, current, net
|
- | 949,121 | ||||||
|
Deferred
incom tax asset, long-term:
|
||||||||
|
Net
operating loss carryforwards
|
3,481,786 | 3,481,786 | ||||||
|
Book
to tax differences for stock based compensation
|
218,565 | 204,805 | ||||||
|
Book
to tax differences in intangible assets
|
7,377,360 | 1,342,999 | ||||||
|
Book
to tax differences in other
|
326 | - | ||||||
|
Book
to tax differences in depreciation
|
(1,574,770 | ) | (1,166,088 | ) | ||||
|
Total
deferred income tax asset, long-term
|
9,503,267 | 3,863,502 | ||||||
|
Less:
valuation allowance
|
(9,503,267 | ) | - | |||||
|
Deferred
income tax asset, net
|
- | 3,863,502 | ||||||
|
Total
deferred income tax asset
|
$ | - | $ | 4,812,623 | ||||
|
12.
|
CONCENTRATION OF CREDIT
RISK
|
|
13.
|
STOCK-BASED
COMPENSATION
|
|
Outstanding
(unvested) at September 30,
2007
|
441,907 | |||
|
Granted
|
53,000 | |||
|
Forfeited
|
(84,169 | ) | ||
|
Vested
|
(183,313 | ) | ||
|
Outstanding
(unvested) at September 30,
2008
|
227,425 | |||
|
Granted
|
20,000 | |||
|
Forfeited
|
(83,250 | ) | ||
|
Vested
|
(57,750 | ) | ||
|
Outstanding
(unvested) at September 30,
2009
|
106,425 |
|
Year Ended September 30,
|
||||||||
|
2009
|
2008
|
|||||||
|
Volatility
|
97 | % | 96 | % | ||||
|
Risk-free
interest rate
|
1.7%-2.8 | % | 2.2 | % | ||||
|
Expected
term
|
6.0
years
|
5.0
years
|
||||||
|
Forfeiture
rate
|
40 | % | 40 | % | ||||
|
Dividend
yield rate
|
0 | % | 0 | % | ||||
|
Weighted
|
Weighted
|
Weighted
|
||||||||||||||||||
|
Average
|
Average
|
Average
|
Aggregate
|
|||||||||||||||||
|
Number of
|
Exercise
|
Fair
|
Remaining
|
Intrinsic
|
||||||||||||||||
|
Shares
|
Price
|
Value
|
Contractual Life
|
Value
|
||||||||||||||||
|
Outstanding
at September 30, 2008
|
5,000 | |||||||||||||||||||
|
Granted
at market price
|
550,000 | $ | 1.45 | $ | 1.13 | |||||||||||||||
|
Exercised
|
- | $ | - | |||||||||||||||||
|
Forfeited
|
(225,000 | ) | $ | 1.45 | ||||||||||||||||
|
Outstanding
at September 30, 2009
|
330,000 | 9.1 | $ | - | ||||||||||||||||
|
Exercisable
|
30,000 | $ | 1.67 | 9.0 | $ | - | ||||||||||||||
|
14.
|
EMPLOYEE BENEFIT
PLAN
|
|
15.
|
OTHER INCOME
(EXPENSE)
|
|
16.
|
SEGMENT
REPORTING
|
|
Year Ended September 30, 2009
|
||||||||||||||||
|
Directory Services
|
Direct Sales -
Customer Acquisition Services |
Unallocated
|
Consolidated
|
|||||||||||||
|
Net
revenues
|
$ | 9,331,057 | $ | 4,107,598 | $ | - | $ | 13,438,655 | ||||||||
|
Cost
of services
|
3,624,177 | 2,767,601 | - | 6,391,778 | ||||||||||||
|
Gross
profit
|
5,706,880 | 1,339,997 | - | 7,046,877 | ||||||||||||
|
Operating
expenses
|
- | - | 25,503,153 | 25,503,153 | ||||||||||||
|
Operating
income (loss)
|
5,706,880 | 1,339,997 | (25,503,153 | ) | (18,456,276 | ) | ||||||||||
|
Other
income (expense)
|
- | - | 7,527,934 | 7,527,934 | ||||||||||||
|
Income
(loss) before income taxes and
|
||||||||||||||||
|
discontinued
operations
|
$ | 5,706,880 | $ | 1,339,997 | $ | (17,975,219 | ) | $ | (10,928,342 | ) | ||||||
|
Year Ended September 30, 2008
|
||||||||||||||||
|
Directory Services
|
Direct Sales -
Customer Acquisition Services |
Unallocated
|
Consolidated
|
|||||||||||||
|
Net
revenues
|
$ | 22,779,222 | $ | 641,436 | $ | - | $ | 23,420,658 | ||||||||
|
Cost
of services
|
3,793,578 | 547,676 | - | 4,341,254 | ||||||||||||
|
Gross
profit
|
18,985,644 | 93,760 | - | 19,079,404 | ||||||||||||
|
Operating
expenses
|
- | - | 20,829,320 | 20,829,320 | ||||||||||||
|
Operating
income
|
18,985,644 | 93,760 | (20,829,320 | ) | (1,749,916 | ) | ||||||||||
|
Other
income (expense)
|
- | - | 122,390 | 122,390 | ||||||||||||
|
Income
before income taxes and
|
||||||||||||||||
|
discontinued
operations
|
$ | 18,985,644 | $ | 93,760 | $ | (20,706,930 | ) | $ | (1,627,526 | ) | ||||||
|
September 30, 2009
|
||||||||||||
|
Directory Services
|
Direct Sales -
Customer Acquisition Services |
Total
|
||||||||||
|
Accounts receivable,
net - short term
|
$ | 1,442,037 | $ | 36,146 | $ | 1,478,183 | ||||||
|
Accounts
receivable, net - long term
|
1,039,403 | - | 1,039,403 | |||||||||
|
Total
accounts receivable, net
|
$ | 2,481,440 | $ | 36,146 | $ | 2,517,586 | ||||||
|
September 30, 2008 (as restated, see Note 3)
|
||||||||||||
|
Directory Services
|
Direct Sales -
Customer Acquisition Services |
Total
|
||||||||||
|
Accounts
receivable, net - short term
|
$ | 6,326,272 | $ | - | $ | 6,326,272 | ||||||
|
Accounts
receivable, net - long term
|
2,011,143 | - | 2,011,143 | |||||||||
|
Total
accounts receivable, net
|
$ | 8,337,415 | $ | - | $ | 8,337,415 | ||||||
|
17.
|
SUBSEQUENT
EVENTS
|
|
18.
|
SELECTED
QUARTERLY FINANCIAL DATA
(UNAUDITED)
|
|
Quarter Ended
|
||||||||||||||||
|
December 31,
|
March 31,
|
June 30,
|
September 30,
|
|||||||||||||
|
2008
|
2009
|
2009
|
2009
|
|||||||||||||
|
Net
revenues
|
$ | 5,009,514 | $ | 3,548,275 | $ | 2,448,569 | $ | 2,432,297 | ||||||||
|
Gross
profit
|
3,408,864 | 2,081,393 | 1,636,248 | (79,628 | ) | |||||||||||
|
Income
(loss) from continuing operations
|
944,440 | (10,797,953 | ) | (2,116,971 | ) | (2,351,373 | ) | |||||||||
|
Income
(loss) from discontinued operations
|
(57,077 | ) | (8,285,663 | ) | 4,649 | 68,648 | ||||||||||
|
Net
income (loss)
|
$ | 887,362 | $ | (19,083,616 | ) | $ | (2,112,322 | ) | $ | (2,282,725 | ) | |||||
|
Earnings
per share information:
|
||||||||||||||||
|
Basic
income per share
|
||||||||||||||||
|
Income
(loss) from continuing operations
|
$ | 0.16 | $ | (1.80 | ) | $ | (0.35 | ) | $ | (0.39 | ) | |||||
|
Discontinued
operations
|
(0.01 | ) | (1.38 | ) | - | 0.01 | ||||||||||
|
Net
income (loss)
|
$ | 0.15 | $ | (3.19 | ) | $ | (0.35 | ) | $ | (0.38 | ) | |||||
|
Diluted
income per share
|
||||||||||||||||
|
Income
(loss) from continuing operations
|
$ | 0.15 | $ | (1.80 | ) | $ | (0.35 | ) | $ | (0.39 | ) | |||||
|
Discontinued
operations
|
(0.01 | ) | (1.38 | ) | - | 0.01 | ||||||||||
|
Net
income (loss)
|
$ | 0.15 | $ | (3.19 | ) | $ | (0.35 | ) | $ | (0.38 | ) | |||||
|
Quarter Ended
|
||||||||||||||||
|
December 31,
|
March 31,
|
June 30,
|
September 30,
|
|||||||||||||
|
2007
|
2008
|
2008
|
2008
|
|||||||||||||
|
Net
revenues
|
$ | 6,406,240 | $ | 6,039,356 | $ | 5,427,012 | $ | 5,548,050 | ||||||||
|
Gross
profit
|
5,412,669 | 4,957,896 | 4,311,719 | 4,397,120 | ||||||||||||
|
Income
(loss) from continuing operations
|
289,545 | 15,195 | (1,519,460 | ) | (258,091 | ) | ||||||||||
|
Income
(loss) from discontinued operations
|
36,547 | (11,857 | ) | (61,237 | ) | (19,414 | ) | |||||||||
|
Net
income (loss)
|
$ | 326,092 | $ | 3,338 | $ | (1,580,697 | ) | $ | (277,505 | ) | ||||||
|
Earnings
per share information:
|
||||||||||||||||
|
Basic
income per share
|
||||||||||||||||
|
Income
(loss) from continuing operations
|
$ | 0.05 | $ | - | $ | (0.24 | ) | $ | (0.04 | ) | ||||||
|
Discontinued
operations
|
0.01 | - | (0.01 | ) | - | |||||||||||
|
Net
income (loss)
|
$ | 0.05 | $ | - | $ | (0.25 | ) | $ | (0.04 | ) | ||||||
|
Diluted
income per share
|
||||||||||||||||
|
Income
(loss) from continuing operations
|
$ | 0.05 | $ | - | $ | (0.24 | ) | $ | (0.04 | ) | ||||||
|
Discontinued
operations
|
0.01 | - | (0.01 | ) | - | |||||||||||
|
Net
income (loss)
|
$ | 0.05 | $ | - | $ | (0.25 | ) | $ | (0.04 | ) | ||||||
|
(1)
|
Financial Statements are listed
on the Index to Consolidated Financial Statements on page 40 of this
Annual Report.
|
|
(2)
|
The following represents
financial statement schedules required to be filed with this Annual
Report:
|
|
/s/ Mayer Hoffman McCann
P.C.
|
|
|
MAYER
HOFFMAN MCCANN P.C.
|
|
|
Phoenix,
Arizona
|
|
|
December
23, 2009
|
|
|
Balance at
|
Charged to
|
Charged to
|
Balance at
|
|||||||||||||||||
|
Beginning
|
Costs and
|
Other
|
Deductions/
|
End of
|
||||||||||||||||
|
Description
|
of Period
|
Expenses
|
Accounts
|
Writeoffs
|
Period
|
|||||||||||||||
|
Allowance
for dilution and fees on amounts due from billing
aggregators
|
||||||||||||||||||||
|
Year
ended September 30, 2008
|
$ | 1,888,730 | $ | 3,999,980 | $ | $ | (4,113,434 | ) | $ | 1,775,276 | ||||||||||
|
Year
ended September 30, 2009
|
$ | 1,775,276 | $ | 5,196,360 | $ | $ | (4,280,741 | ) | $ | 2,690,895 | ||||||||||
|
Allowance
for customer refunds
|
||||||||||||||||||||
|
Year
ended September 30, 2008
|
$ | 573,068 | $ | 3,357,512 | $ | $ | (3,502,311 | ) | $ | 428,269 | ||||||||||
|
Year
ended September 30, 2009
|
$ | 428,269 | $ | 2,511,706 | $ | $ | (2,789,544 | ) | $ | 150,431 | ||||||||||
|
Exhibit
Number
|
Description
|
Previously
Filed as Exhibit
|
File Number
|
Date
Previously
Filed
|
||||
|
3.1
|
Amended
and Restated Articles of Incorporation
|
Exhibit
3.1 to the Registrant’s Current Report on Form 8-K filed on August 15,
2007
|
000-24217
|
8/15/07
|
||||
|
3.2
|
Amended
and Restated Bylaws
|
Exhibit
3.2 to the Registrant’s Annual Report on Form 10-K for the fiscal year
ended September 30, 2007
|
00-24217
|
12/20/07
|
||||
|
10.1
|
LiveDeal,
Inc. Amended and Restated 2003 Stock Plan*
|
Exhibit
10.1 to the Registrant’s Annual Report on Form 10-K for the fiscal year
ended September 30, 2007
|
00-24217
|
12/20/07
|
||||
|
10.1.1
|
First
Amendment to Amended and Restated 2003 Stock Plan*
|
Appendix
A to 2009 Proxy Statement
|
00-24217
|
1/29/09
|
||||
|
10.2
|
Form
of 2003 Stock Plan Restricted Stock Agreement*
|
Exhibit
10 to the Registrant’s Quarterly Report on Form 10-QSB for the fiscal
quarter ending March 31, 2005
|
000-24217
|
5/16/05
|
||||
|
10.3
|
Form
of 2003 Stock Plan Stock Option Agreement*
|
Exhibit
10.3 to the Registrant’s Annual Report on Form 10-K for the fiscal year
ending September 30, 2008
|
000-24217
|
12/29/08
|
||||
|
10.4
|
Standard
Industrial/Commercial Multi-Tenant Lease for Mesa facility, dated June 1,
1998, between the Registrant and Art Grandlich, d/b/a McKellips Corporate
Square
|
Exhibit
10.5 to the Registrant’s Annual Report on Form 10-KSB for the fiscal year
ended September 30, 1999
|
000-24217
|
9/19/00
|
||||
|
10.4.1
|
Amendment
No. 1 to Standard Industrial/Commercial Multi-Tenant Lease for Mesa
facility, dated August 17, 1998, between the Registrant and Arthur
Grandlich, d/b/a McKellips Corporate Square
|
Exhibit
10.4 to the Registrant’s Annual Report on Form 10-K for the fiscal year
ended September 30, 2006
|
000-24217
|
12/29/06
|
||||
|
10.4.2
|
Amendment
No. 2 to Standard Industrial/Commercial Multi-Tenant Lease for Mesa
facility, dated January 7, 2003, between the Registrant and Arthur
Grandlich, d/b/a McKellips Corporate Square
|
Exhibit
10.14 to Amendment No. 2 to the Registrant’s Annual Report on Form
10-KSB/A for the fiscal year ended September 30,
2002
|
000-24217
|
7/8/03
|
||||
|
10.4.3
|
Amendment
No. 3 to Standard Industrial/Commercial Multi-Tenant Lease for Mesa
facility, dated March 23, 2006, between the Registrant and J3 Harmon,
LLC, successor in interest to The Estate of Arthur
Grandlich
|
Exhibit
10.4.2 to the Registrant’s Annual Report on Form 10-K for the fiscal year
ended September 30, 2006
|
000-24217
|
12/29/06
|
||||
|
10.4.4
|
Amendment
No. 4 to Standard Industrial/Commercial Multi-Tenant Lease for Mesa
facility, dated April 12, 2006, between the Registrant and J3 Harmon,
LLC, successor in interest to The Estate of Arthur
Grandlich
|
Exhibit
10.4.3 to the Registrant’s Annual Report on Form 10-K for the fiscal year
ended September 30, 2006
|
000-24217
|
12/29/06
|
|
10.5
|
Standard
Industrial Lease for Nevada facility, dated September 3, 2003, between the
Registrant and Tomorrow 33 Convention, LP
|
Exhibit
10.4 to the Registrant’s Annual Report on Form 10-KSB for the fiscal year
ended September 30, 2003
|
000-24217
|
12/31/03
|
||||
|
10.6
|
Amendment
No. 1 to Standard Industrial Lease for Nevada facility, dated October 4,
2006, between the Registrant and Tomorrow 33 Convention,
LP
|
Exhibit
10.6 to the Registrant’s Annual Report on Form 10-K for the fiscal year
ended September 30, 2006
|
000-24217
|
12/29/06
|
|
10.7
|
Master
Services Agreement, dated August 1, 2002, between the Registrant and
eBillit, Inc.
|
Exhibit
10.24 to Amendment No. 1 to the Registrant’s Quarterly Report on Form
10-QSB/A for the fiscal quarter ended March 31, 2003
|
000-24217
|
7/8/03
|
||||
|
10.8
|
Billings
and Related Services Agreement, dated September 1, 2001, between the
Registrant and ACI Communications, Inc.
|
Exhibit
10.33 to Amendment No. 2 to the Registrant’s Annual Report on Form
10-KSB/A for the fiscal year ended September 30,
2002
|
000-24217
|
7/8/03
|
||||
|
10.9
|
Asset
Purchase Agreement dated as of July 10, 2007, relating to the Registrant’s
acquisition of the assets of OnCall Subscriber Management
Inc.
|
Exhibit
10.1 to the Registrant’s Current Report on Form 8-K filed on July 16,
2007
|
000-24217
|
7/16/07
|
||||
|
10.10
|
Escrow
Agreement dated as of July 10, 2007, relating to the Registrant’s
acquisition of the assets of OnCall Subscriber Management
Inc.
|
Exhibit
10.2 to the Registrant’s Current Report on Form 8-K filed on July 16,
2007
|
000-24217
|
7/16/07
|
||||
|
10.11
|
Domain
Name Purchase and Transfer Agreement, dated November 5, 2008, between the
Registrant and YellowPages.com LLC
|
Exhibit
10.1 to the Registrant’s Quarterly Report on Form 10-Q for the quarterly
period ended December 31, 2008
|
000-24217
|
2/17/09
|
||||
|
10.12
|
Employment
Agreement, dated as of November 17, 2008, by and between the Registrant
and Rajeev Seshadri*
|
Exhibit
10.2 to the Registrant’s Quarterly Report on Form 10-Q for the quarterly
period ended December 31, 2008
|
000-24217
|
2/17/09
|
||||
|
10.13
|
Asset
Purchase Agreement, dated as of March 9, 2009, by and among the
Registrant, Telco Billing, Inc., and Local.com Corporation
|
Exhibit
10.1 to the Registrant’s Quarterly Report on Form 10-Q for the quarterly
period ended March 31, 2009
|
000-24217
|
5/15/09
|
||||
|
10.14
|
Employment
Agreement, dated as of October 1, 2008, by and between the Registrant and
Dean Heistad*
|
Exhibit
10.2 to the Registrant’s Quarterly Report on Form 10-Q for the quarterly
period ended March 31, 2009
|
000-24217
|
5/15/09
|
||||
|
10.15
|
Employment
Agreement, dated as of October 1, 2008, by and between the Registrant and
Gregg Thaler*
|
Exhibit
10.3 to the Registrant’s Quarterly Report on Form 10-Q for the quarterly
period ended March 31, 2009
|
000-24217
|
5/15/09
|
||||
|
10.16
|
Employment
Agreement, dated as of May 19, 2009, by and between the Registrant and
Richard F. Sommer*
|
Exhibit
10.1 to the Registrant’s Quarterly Report on Form 10-Q for the quarterly
period ended June 30, 2009
|
000-24217
|
8/14/09
|
||||
|
10.17
|
Separation
Agreement and Full Release of Claims, dated as of June 30, 2009, by and
between the Registrant and Mike Edelhart*
|
Exhibit
10.2 to the Registrant’s Quarterly Report on Form 10-Q for the quarterly
period ended June 30, 2009
|
000-24217
|
8/14/09
|
||||
|
10.18
|
First
Amendment to Employment Agreement, effective as of October 29, 2009, by
and between the Registrant and Richard F. Sommer*
|
Attached
hereto
|
||||||
|
10.19
|
Separation
Agreement and Full Release of Claims, dated as of November 25, 2009, by
and between the Registrant and Rajeev Seshadri*
|
Attached
hereto
|
||||||
|
14
|
Code
of Business Conduct and Ethics, Adopted December 31,
2003
|
Exhibit
14 to the Registrant’s Quarterly Report on Form 10-QSB for the period
ended March 31, 2004
|
000-24217
|
5/13/04
|
|
21
|
Company
Subsidiaries
|
Attached
hereto
|
||||||
|
23
|
Consent
of Mayer Hoffman McCann P.C.
|
Attached
hereto
|
||||||
|
31
|
Certifications
pursuant to SEC Release No. 33-8238, as adopted pursuant to Section 302 of
the Sarbanes-Oxley Act of 2002
|
Attached
hereto
|
||||||
|
32
|
Certifications
pursuant to 18 U.S.C. Section 1350, as adopted pursuant to Section 906 of
the Sarbanes-Oxley Act of 2002
|
Attached
hereto
|
|
Dated: December
23, 2009
|
/s/Richard
Sommer
|
|
Richard
Sommer
|
|
|
Chief
Executive Officer
|
|
Signature
|
Title
|
Date
|
||
|
/s/
Richard Sommer
|
Chief
Executive Officer (Principal Executive
Officer)
|
December
23, 2009
|
||
|
Richard
Sommer
|
||||
|
/s/
Rajeev Seshadri
|
Chief
Financial Officer (Principal Financial Officer
and
|
December
23, 2009
|
||
|
Rajeev
Seshadri
|
Principal
Accounting Officer)
|
|||
|
/s/
Richard D. Butler.
|
Director
|
December
23, 2009
|
||
|
Richard
D. Butler
|
||||
|
/s/
Sheryle Bolton
|
Director
|
December
23, 2009
|
||
|
Sheryle
Bolton
|
||||
|
/s/
Thomas Clarke, Jr.
|
Director
|
December
23, 2009
|
||
|
Thomas
Clark, Jr
|
||||
|
/s/
Greg LeClaire
|
Director
|
December
23, 2009
|
||
|
Greg
LeClaire
|
||||
|
/s/
Joseph Huber
|
Director
|
December
23, 2009
|
||
|
Joseph
Huber
|
||||