|
x
|
ANNUAL REPORT PURSUANT TO SECTION
13 OR 15(d) OF THE SECURITIES EXCHANGE ACT OF
1934
|
|
¨
|
TRANSITION REPORT UNDER SECTION
13 OR 15 (d) OF THE SECURITIES EXCHANGE ACT OF
1934
|
|
Nevada
|
85-0206668
|
|||
|
(State
or Other Jurisdiction of Incorporation or
Organization)
|
(IRS
Employer Identification No.)
|
|
2490
East Sunset Road, Suite 100
Las
Vegas, Nevada
|
89120
|
|||
|
(Address
of principal executive offices)
|
(Zip
Code)
|
|
Large
accelerated filer o
|
Accelerated
filer o
|
|
|
Non-accelerated
filer o (Do
not check if a smaller reporting company)
|
Smaller
reporting company x
|
|
Page
|
|||
|
Part
I
|
|||
|
Item
1.
|
Business
|
3
|
|
|
Item
1A.
|
Risk
Factors
|
7
|
|
|
Item
1B.
|
Unresolved
Staff Comments
|
15
|
|
|
Item
2.
|
Properties
|
15
|
|
|
Item
3.
|
Legal
Proceedings
|
15
|
|
|
Item
4.
|
(Removed
and Reserved)
|
16
|
|
|
Part
II
|
|||
|
Item
5.
|
Market
for Registrant’s Common Equity, Related Stockholder Matters and Issuer
Purchases of Equity Securities
|
17
|
|
|
Item
6.
|
Selected
Financial Data
|
18
|
|
|
Item
7.
|
Management’s
Discussion and Analysis of Financial Condition and Results of
Operations
|
18
|
|
|
Item
7A.
|
Quantitative
and Qualitative Disclosures About Market Risk
|
27
|
|
|
Item
8.
|
Financial
Statements and Supplementary Data
|
28
|
|
|
Report
of Independent Registered Public Accounting Firm
|
29
|
||
|
Consolidated
Financial Statements:
|
|||
|
Consolidated
Balance Sheets at September 30, 2010 and 2009
|
30
|
||
|
Consolidated
Statements of Operations for the Years Ended September 30, 2010 and
2009
|
31
|
||
|
Consolidated
Statements of Stockholders' Equity for the Years Ended September 30, 2010
and 2009
|
32
|
||
|
Consolidated
Statements of Cash Flows for the Years Ended September 30, 2010 and
2009
|
33
|
||
|
Notes
to Consolidated Financial Statements
|
34
|
||
|
Item
9.
|
Changes
in and Disagreements With Accountants on Accounting and Financial
Disclosure
|
53
|
|
|
Item
9A.
|
Controls
and Procedures
|
53
|
|
|
Item
9B.
|
Other
Information
|
|
|
|
Part
III
|
|||
|
Item
10.
|
Directors,
Executive Officers and Corporate Governance
|
54
|
|
|
Item
11.
|
Executive
Compensation
|
54
|
|
|
Item
12.
|
Security
Ownership of Certain Beneficial Owners and Management and Related
Stockholder Matters
|
54
|
|
|
Item
13.
|
Certain
Relationships and Related Transactions, and Director
Independence
|
54
|
|
|
Item
14.
|
Principal
Accounting Fees and Services
|
54
|
|
|
Part
IV
|
|||
|
Item
15.
|
Exhibits,
Financial Statement Schedules
|
54
|
|
|
Signatures
|
58
|
||
|
|
§
|
One
location to manage business contact information through the syndication
network to the top search engines, directories, and social media
networks.
|
|
|
§
|
Broadcasting
messages to the top social media
networks.
|
|
|
§
|
Conference
call solution.
|
|
|
§
|
Electronic
faxing solution.
|
|
|
§
|
Total
Local advertising spend is forecast at $133.33 billion in 2010,
rising to $137.3 billion in 2012 and to $145.2 billion in
2014.
|
|
|
§
|
The
local advertising market is currently dominated by traditional media,
however, there is a steady increase in online spending from $19.6 billion
in 2010 to $35.2 billion projected in
2014.
|
|
|
§
|
By
comparison, classifieds and verticals ended 2009 at $3.9 billion, down $1
billion from 2008. Classified performance last year declined
substantially, down 30% in the second quarter, year over year, and down
21% for the full year. Classifieds as a format continues to
struggle.
|
|
|
§
|
Online
advertising reaches more users as search queries continue to increase as
local newspapers, printed directories and other local printed mediums
continue to reduce circulation (and, in turn, their impact and reach) due
to high cost and in turn their
reach.
|
|
|
§
|
Online
users are becoming trained to use the Internet as a whole and not only
their computer largely due to the broad accessibility via computers and
hand-held devices, such as mobile phones and personal digital
assistant.
|
|
|
§
|
Features
such as mapping, direct calling to the advertiser, and e-mail at the click
of a button have become more
prevalent.
|
|
|
§
|
Eliminated
homegrown systems in favor of open, best-of-breed
solutions
|
|
|
-
|
Lower
cost approach
|
|
|
-
|
No
future development costs
|
|
|
-
|
Better
back-up and reliability
|
|
|
§
|
Able
to partner with any vendor or
platform
|
|
|
-
|
Plug
and play approach
|
|
|
-
|
Greatly
improved speed to market
|
|
|
-
|
Increased
flexibility
|
|
|
§
|
We
have gone to cloud computing options to replace and maintain outdated
hardware
|
|
|
§
|
some competitors have longer
operating histories and greater financial and other resources than we have
and are in better financial condition than we
are;
|
|
|
§
|
some competitors have better name
recognition, as well as larger, more established, and more extensive
marketing, customer service, and customer support capabilities than we
have;
|
|
|
§
|
some competitors may supply a
broader range of services, enabling them to serve more or all of their
customers’ needs;
|
|
|
§
|
some competitors may be able to
better adapt to changing market conditions and customer demand;
and
|
|
|
§
|
barriers to entry are not
significant. As a result, other companies that are not
currently involved in the online marketing business may enter the market
or develop technology that reduces the need for our
services.
|
|
|
§
|
fluctuating demand for our
services, which may depend on a number of factors including:
|
|
|
-
|
changes in economic conditions
and our advertisers’
profitability,
|
|
|
-
|
advertiser refunds or
cancellations, and
|
|
|
-
|
our ability to continue to bill
through existing means;
|
|
|
§
|
market acceptance of new or
enhanced versions of our services or
products;
|
|
|
§
|
price competition or pricing
changes by us or our
competitors;
|
|
|
§
|
new product offerings or other
actions by our competitors;
|
|
|
§
|
the ability of our check
processing service providers to continue to process and provide billing
information regarding our solicitation
checks;
|
|
|
§
|
the amount and timing of
expenditures for expansion of our operations, including the hiring of new
employees, capital expenditures, and related
costs;
|
|
|
§
|
technical difficulties or
failures affecting our systems or the Internet in
general;
|
|
|
§
|
a decline in Internet traffic at
our website; and
|
|
|
§
|
the fixed nature of a significant
amount of our operating
expenses.
|
|
|
§
|
the pace of expansion of our
operations;
|
|
|
§
|
our need to respond to
competitive pressures; and
|
|
|
§
|
future acquisitions of
complementary products, technologies or
businesses.
|
|
|
§
|
cease selling or using any of our
products that incorporate the challenged intellectual property, which
would adversely affect our
revenue;
|
|
|
§
|
obtain a license from the holder
of the intellectual property right alleged to have been infringed, which
license may not be available on reasonable terms, if at all;
and
|
|
|
§
|
redesign or, in the case of
trademark claims, rename our products or services to avoid infringing the
intellectual property rights of third parties, which may not be possible
and in any event could be costly and
time-consuming.
|
|
|
§
|
exposure
to unanticipated liabilities of an acquired company (or acquired
assets);
|
|
|
§
|
the
potential loss of key customers or key personnel in connection with, or as
the result of, a transaction;
|
|
|
§
|
the
recording of goodwill and intangible assets that will be subject to
impairment testing on a regular basis and potential periodic impairment
charges;
|
|
|
§
|
the
diversion of the attention of our management team from other business
concerns, including the day-to-day management of our Company and/or the
internal growth strategies that they are currently implementing;
and
|
|
|
§
|
the
risk of entering into markets or producing products where we have limited
or no experience, including the integration of the purchased technologies
and products with our technologies and
products.
|
|
|
§
|
rapid technological
change;
|
|
|
§
|
changes in advertiser and user
requirements and
preferences;
|
|
|
§
|
frequent new product and service
introductions embodying new technologies;
and
|
|
|
§
|
the emergence of new industry
standards and practices that could render our existing service offerings,
technology, and hardware and software infrastructure
obsolete.
|
|
|
§
|
enhance our existing services and
develop new services and technology that address the increasingly
sophisticated and varied needs of our prospective or current
advertisers;
|
|
|
§
|
license, develop or acquire
technologies useful in our business on a timely basis;
and
|
|
|
§
|
respond to technological advances
and emerging industry standards and practices on a cost-effective and
timely basis.
|
|
|
§
|
decreased demand in the Internet
services sector;
|
|
|
§
|
variations in our operating
results;
|
|
|
§
|
announcements of technological
innovations or new services by us or our
competitors;
|
|
|
§
|
changes in expectations of our
future financial performance, including financial estimates by securities
analysts and investors;
|
|
|
§
|
our failure to meet analysts’
expectations;
|
|
|
§
|
changes in operating and stock
price performance of other technology companies similar to
us;
|
|
|
§
|
conditions or trends in the
technology industry;
|
|
|
§
|
additions or departures of key
personnel; and
|
|
|
§
|
future sales of our common
stock.
|
|
|
§
|
the authority of our board to
issue up to 5,000,000 shares of preferred stock
and to determine the price, rights, preferences, and privileges of these
shares, without stockholder
approval;
|
|
|
§
|
all stockholder actions must be
effected at a duly called meeting of stockholders and not by written
consent unless such action or proposal is first approved by our board of
directors;
|
|
|
§
|
special
meetings of the stockholders may be called only by the Chairman of the
Board, the Chief Executive Officer, or the President of our company;
and
|
|
|
§
|
cumulative
voting is not allowed in the election of our
directors.
|
|
Quarter Ended
|
High
|
Low
|
|||||||
|
2009
|
December
31, 2008
|
$ | 20.00 | $ | 10.20 | ||||
|
March
31, 2009
|
$ | 22.00 | $ | 12.40 | |||||
|
June
30, 2009
|
$ | 21.00 | $ | 10.00 | |||||
|
September
30, 2009
|
$ | 17.00 | $ | 10.10 | |||||
|
2010
|
December
31, 2009
|
$ | 23.80 | $ | 11.70 | ||||
|
March
31, 2010
|
$ | 17.00 | $ | 5.50 | |||||
|
June
30, 2010
|
$ | 8.40 | $ | 5.00 | |||||
|
September
30, 2010
|
$ | 7.41 | $ | 3.30 | |||||
|
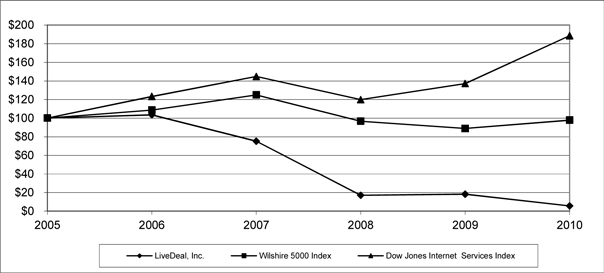
9/30/2005
|
9/30/2006
|
9/30/2007
|
9/30/2008
|
9/30/2009
|
9/30/2010
|
|||||||||||||||||||
|
LiveDeal,
Inc.
|
$ | 100.00 | $ | 103.53 | $ | 75.20 | $ | 17.06 | $ | 18.20 | $ | 5.62 | ||||||||||||
|
Wilshire
5000 Index
|
$ | 100.00 | $ | 108.60 | $ | 125.00 | $ | 96.63 | $ | 88.79 | $ | 97.82 | ||||||||||||
|
Dow
Jones Internet Services Index
|
$ | 100.00 | $ | 123.32 | $ | 144.75 | $ | 119.86 | $ | 137.08 | $ | 188.55 | ||||||||||||
|
|
§
|
The
current effects of the recovery from the recent recession and general
economic downturn;
|
|
|
§
|
Our
perception that the general economic downturn could lead our business
customers to seek lower-cost customer acquisition methods, primarily
through the Internet;
|
|
|
§
|
The
reconstitution of our management
team;
|
|
|
§
|
The
termination of certain significant directory business contracts related to
the traditional business; and
|
|
|
§
|
Continuing
losses in our Direct Sales
business.
|
|
Year Ended
September 30,
|
Net
Revenues
|
Change from
Prior Year
|
Percent Change
from Prior Year
|
|||||||||
|
2010
|
$ | 8,077,434 | $ | (5,361,221 | ) | (39.9 | )% | |||||
|
2009
|
$ | 13,438,655 | ||||||||||
|
Year Ended
September 30,
|
Cost of
Services
|
Change from
Prior Year
|
Percent Change
from Prior Year
|
|||||||||
|
2010
|
$ | 3,857,684 | $ | (2,534,094 | ) | (39.6 | )% | |||||
|
2009
|
$ | 6,391,778 | ||||||||||
|
Year Ended
September 30,
|
Gross
Profit
|
Change from
Prior Year
|
Percent Change
from Prior Year
|
|||||||||
|
2010
|
$ | 4,219,750 | $ | (2,827,127 | ) | (40.1 | )% | |||||
|
2009
|
$ | 7,046,877 | ||||||||||
|
|
Year ended September 30,
|
|||||||
|
|
2010
|
2009
|
||||||
|
|
||||||||
|
Customer
acquisition services -
|
||||||||
|
Gross
profit
|
$ | 741,949 | $ | 1,339,997 | ||||
|
Gross
margin
|
19.3 | % | 32.6 | % | ||||
|
Directory
services -
|
||||||||
|
Gross
profit
|
$ | 3,477,801 | $ | 5,706,880 | ||||
|
Gross
margin
|
82.1 | % | 61.2 | % | ||||
|
Year Ended
September 30,
|
General &
Administrative
Expenses
|
Change from
Prior Year
|
Percent Change
from Prior Year
|
|||||||||
|
2010
|
$ | 11,734,122 | $ | (3,445,859 | ) | (22.7 | )% | |||||
|
2009
|
$ | 15,179,981 | ||||||||||
|
|
·
|
A
decrease in compensation and compensation-related expenses of $3,658,000
reflecting the impacts of our restructuring actions and reduction in force
during 2009 and 2010 from 111 employees at September 30, 2009 to 73 at
September 30, 2010, which employee count, from September 30, 2010 to
November 30, 2010, has further decreased from 73 to 60 due to attrition
during the course of normal business operations, decreased further on
December 1, 2010 by 36 employees due to the reduction in force described
herein and the resignation of 1 additional employee on December 3, 2010,
resulting in an employee count of 23 as of December 20,
2010;
|
|
|
·
|
A
decrease in depreciation and amortization expense of approximately
$644,000 due primarily to the effects of the impairment of amortizable
intangible assets that occurred in the second quarter of fiscal
2009;
|
|
|
·
|
A
decrease in rent, utilities and office expenses of approximately $485,000
as a result of the closure of our Santa Clara and New York facilities and
other cost-containment initiatives;
and
|
|
|
·
|
Other
miscellaneous cost decreases of approximately
$85,000; partially offset
by
|
|
|
·
|
An
increase in legal settlement costs of $310,000 reflecting a settlement of
$300,000 in the first quarter of fiscal 2010 with On-Call Superior
Management (“OSM”) and SMeVentures, Inc. (“SMe”) and a $10,000 payment in
the fourth quarter of fiscal 2010 associated with our settlement with the
Illinois Attorney General. See Part I, Item
3. Legal Proceedings in this report for further information;
and
|
|
|
·
|
An
increase in professional fees of $1,116,000 reflecting an increase in IT
infrastructure and product development costs of $828,000 as we develop our
next-generation of products, increased legal fees of $262,000 as we defend
several litigation matters related to our legacy businesses and $26,000 in
other miscellaneous increases in professional
fees.
|
|
Q4 2010
|
Q3 2010
|
Q2 2010
|
Q1 2010
|
Q4 2009
|
Q3 2009
|
Q2 2009
|
Q1 2009
|
|||||||||||||||||||||||||
|
Compensation
for employees, leased employees, officers and
directors
|
$ | 1,048,094 | $ | 967,323 | $ | 1,352,108 | $ | 2,241,198 | $ | 2,054,709 | $ | 2,392,081 | $ | 2,311,056 | $ | 2,508,836 | ||||||||||||||||
|
Professional
fees
|
551,394 | 677,507 | 1,023,582 | 488,993 | 336,273 | 421,700 | 411,564 | 455,832 | ||||||||||||||||||||||||
|
Depreciation
and amortization
|
214,617 | 215,102 | 218,200 | 225,653 | 211,336 | 186,077 | 560,383 | 559,289 | ||||||||||||||||||||||||
|
Other
general and administrative costs
|
462,278 | 497,865 | 544,162 | 1,006,046 | 451,300 | 813,124 | 771,352 | 735,070 | ||||||||||||||||||||||||
|
Year Ended
September 30,
|
Sales &
Marketing
Expenses
|
Change from
Prior Year
|
Percent Change
from Prior Year
|
|||||||||
|
2010
|
$ | 226,442 | $ | (2,230,621 | ) | (90.8 | )% | |||||
|
2009
|
$ | 2,457,063 | ||||||||||
|
|
·
|
$1,908,000
of decreased telemarketing and other customer acquisition costs as we
significantly decreased these activities in light of our changing business
strategy and cost containment initiatives;
and
|
|
|
·
|
$323,000
of decreased branding, online advertising and click traffic as part of our
cost containment initiatives.
|
|
Year Ended
September 30,
|
Impairment of Goodwill
and Intangible Assets
|
Change from
Prior Year
|
Percent Change
from Prior Year
|
|||||||||
|
2010
|
$ | - | $ | (7,866,109 | ) | (100 | )% | |||||
|
2009
|
$ | 7,866,109 | ||||||||||
|
Year Ended
September 30,
|
Operating
Loss
|
Change from
Prior Year
|
Percent Change
from Prior Year
|
|||||||||
|
2010
|
$ | (7,740,814 | ) | $ | 10,715,462 | (58.1 | )% | |||||
|
2009
|
$ | (18,456,276 | ) | |||||||||
|
Year Ended
September 30,
|
Total Other Income
(Expense)
|
Change from
Prior Year
|
Percent Change
from Prior Year
|
|||||||||
|
2010
|
$ | 41,189 | $ | (7,486,745 | ) | (99.5 | )% | |||||
|
2009
|
$ | 7,527,934 | ||||||||||
|
|
·
|
$50,000
adjustment to the gain on sale of our customer list from fiscal 2009
reflecting adjustments to certain
accruals;
|
|
|
·
|
$18,000
of interest income on cash balances; partially offset
by
|
|
|
·
|
($27,000)
loss on disposal of fixed assets.
|
|
|
·
|
$3,041,000
from the sale of a portion of our customer list associated with our
directory services
business;
|
|
|
·
|
$642,000 from an amendment to
another directory services contract in consideration of accelerated
payments on our outstanding accounts
receivables;
|
|
|
·
|
$3,806,000
from an agreement to sell our Internet domain name “www.yp.com” to
YellowPages.com; and
|
|
|
·
|
$39,000
of interest income on cash balances and short term
investments
|
|
Year Ended
September 30,
|
Income Tax
Provision (Benefit)
|
Change from
Prior Year
|
Percent Change
from Prior Year
|
|||||||||
|
2010
|
$ | (230,382 | ) | $ | (3,623,897 | ) | (106.8 | )% | ||||
|
2009
|
$ | 3,393,515 | ||||||||||
|
Year Ended
September 30,
|
Income (Loss) from
Discontinued Operations
|
Change from
Prior Year
|
Percent Change
from Prior Year
|
|||||||||
|
2010
|
$ | 12,525 | $ | 8,281,968 | 100.2 | % | ||||||
|
2009
|
$ | (8,269,443 | ) | |||||||||
|
Year Ended
September 30,
|
Net Loss
|
Change from
Prior Year
|
Percent Change
from Prior Year
|
|||||||||
|
2010
|
$ | (7,456,718 | ) | $ | 15,134,582 | (67.0 | )% | |||||
|
2009
|
$ | (22,591,300 | ) | |||||||||
|
Payments Due by Fiscal Year
|
||||||||||||||||||||||||||||
|
Total
|
2011
|
2012
|
2013
|
2014
|
2015
|
Thereafter
|
||||||||||||||||||||||
|
Operating
lease commitments
|
$ | 813,516 | $ | 419,465 | $ | 315,331 | $ | 78,720 | $ | - | $ | - | $ | - | ||||||||||||||
|
Capital
lease commitments
|
101,560 | 64,143 | 37,417 | - | - | - | - | |||||||||||||||||||||
|
Noncanceleable
service contracts
|
773,583 | 635,583 | 138,000 | - | - | - | - | |||||||||||||||||||||
| $ | 1,688,659 | $ | 1,119,191 | $ | 490,748 | $ | 78,720 | $ | - | $ | - | $ | - | |||||||||||||||
|
Page
|
||
|
Report
of Independent Registered Public Accounting Firm
|
29
|
|
|
Consolidated
Financial Statements:
|
||
|
Consolidated
Balance Sheets at September 30, 2010 and 2009
|
30
|
|
|
Consolidated
Statements of Operations for the years ended September 30, 2010 and
2009
|
31
|
|
|
Consolidated
Statements of Stockholders’ Equity for the years ended September 30, 2010
and 2009
|
32
|
|
|
Consolidated
Statements of Cash Flows for the years ended September 30, 2010 and
2009
|
33
|
|
|
Notes
to Consolidated Financial Statements
|
34
|
|
|
|
September 30,
|
|||||||
|
|
2010
|
2009
|
||||||
|
|
||||||||
|
Assets
|
||||||||
|
Cash
and cash equivalents
|
$ | 3,227,374 | $ | 7,568,030 | ||||
|
Certificates
of deposit
|
101,293 | 100,000 | ||||||
|
Accounts
receivable, net
|
948,439 | 1,478,183 | ||||||
|
Prepaid
expenses and other current assets
|
219,121 | 326,442 | ||||||
|
Income
taxes receivable
|
- | 1,490,835 | ||||||
|
Total
current assets
|
4,496,227 | 10,963,490 | ||||||
|
Accounts
receivable, long term portion, net
|
330,234 | 1,039,403 | ||||||
|
Property
and equipment, net
|
397,382 | 615,906 | ||||||
|
Deposits
and other assets
|
49,294 | 81,212 | ||||||
|
Intangible
assets, net
|
1,938,952 | 2,336,714 | ||||||
|
Total
assets
|
$ | 7,212,089 | $ | 15,036,725 | ||||
|
Liabilities
and Stockholders' Equity
|
||||||||
|
Liabilities:
|
||||||||
|
Accounts
payable
|
$ | 354,440 | $ | 549,681 | ||||
|
Accrued
liabilities
|
880,188 | 1,092,811 | ||||||
|
Current
portion of capital lease obligation
|
60,327 | 69,612 | ||||||
|
Total
current liabilities
|
1,294,955 | 1,712,104 | ||||||
|
Long
term portion of capital lease obligation
|
38,283 | 117,073 | ||||||
|
Total
liabilities
|
1,333,238 | 1,829,177 | ||||||
|
Commitments
and contingencies
|
||||||||
|
Stockholders'
equity:
|
||||||||
|
Series
E convertible preferred stock, $0.001 par value, 200,000 shares
authorized,
|
||||||||
|
127,840
issued and outstanding, liquidation preference $38,202
|
10,866 | 10,866 | ||||||
|
Common
stock, $0.01 par value, 10,000,000 shares authorized, 609,643 issued
and
|
||||||||
|
605,391
outstanding at September 30, 2010 and 613,343 issued and
|
||||||||
|
610,433
outstanding at September 30, 2009
|
6,096 | 6,133 | ||||||
|
Treasury
stock (4,252 and 2,910 shares carried at cost) at September 30, 2010 and
2009, respectively
|
(70,923 | ) | (45,041 | ) | ||||
|
Paid
in capital
|
20,436,235 | 20,280,377 | ||||||
|
Accumulated
deficit
|
(14,503,423 | ) | (7,044,787 | ) | ||||
|
Total
stockholders' equity
|
5,878,851 | 13,207,548 | ||||||
|
Total
liabilities and stockholders' equity
|
$ | 7,212,089 | $ | 15,036,725 | ||||
|
Year ended September 30,
|
||||||||
|
2010
|
2009
|
|||||||
|
Net
revenues
|
$ | 8,077,434 | $ | 13,438,655 | ||||
|
Cost
of services
|
3,857,684 | 6,391,778 | ||||||
|
Gross
profit
|
4,219,750 | 7,046,877 | ||||||
|
Operating
expenses:
|
||||||||
|
General
and administrative expenses
|
11,734,122 | 15,179,981 | ||||||
|
Impairment
of goodwill
|
- | 4,350,041 | ||||||
|
Impairment
of intangible assets
|
- | 3,516,068 | ||||||
|
Sales
and marketing expenses
|
226,442 | 2,457,063 | ||||||
|
Total
operating expenses
|
11,960,564 | 25,503,153 | ||||||
|
Operating
loss
|
(7,740,814 | ) | (18,456,276 | ) | ||||
|
Other
income (expense):
|
||||||||
|
Interest
income, net
|
18,186 | 37,686 | ||||||
|
Other
income (expense)
|
23,003 | 7,490,248 | ||||||
|
Total
other income (expense)
|
41,189 | 7,527,934 | ||||||
|
Loss
before income taxes
|
(7,699,625 | ) | (10,928,342 | ) | ||||
|
Income
tax provision (benefit)
|
(230,382 | ) | 3,393,515 | |||||
|
Loss
from continuing operations
|
(7,469,243 | ) | (14,321,857 | ) | ||||
|
Discontinued
operations
|
||||||||
|
Income
(loss) from discontinued component, including disposal
costs
|
12,525 | (8,329,470 | ) | |||||
|
Income
tax benefit
|
- | (60,027 | ) | |||||
|
Income
(loss) from discontinued operations
|
12,525 | (8,269,443 | ) | |||||
|
Net
loss
|
$ | (7,456,718 | ) | $ | (22,591,300 | ) | ||
|
Earnings
per share – Basic:
|
||||||||
|
Loss
from continuing operations
|
$ | (12.45 | ) | $ | (23.85 | ) | ||
|
Discontinued
operations
|
0.02 | (13.77 | ) | |||||
|
Net
loss
|
$ | (12.43 | ) | $ | (37.62 | ) | ||
|
Earnings
per share - Diluted:
|
||||||||
|
Loss
from continuing operations
|
$ | (12.45 | ) | $ | (23.85 | ) | ||
|
Discontinued
operations
|
0.02 | (13.77 | ) | |||||
|
Net
loss
|
$ | (12.43 | ) | $ | (37.62 | ) | ||
|
Weighted
average common shares outstanding:
|
||||||||
|
Basic
|
599,928 | 600,566 | ||||||
|
Diluted
|
599,928 | 600,566 | ||||||
|
|
Common Stock
|
Preferred Stock
|
Treasury
|
Paid-In
|
Accumulated
|
|||||||||||||||||||||||||||
|
|
Shares
|
Amount
|
Shares
|
Amount
|
Stock
|
Capital
|
Deficit
|
Total
|
||||||||||||||||||||||||
|
|
||||||||||||||||||||||||||||||||
|
Balance,
September 30, 2008
|
651,368 | $ | 6,514 | 127,840 | $ | 10,866 | $ | - | $ | 20,884,112 | $ | 15,548,431 | $ | 36,449,923 | ||||||||||||||||||
|
Series
E preferred stock dividends
|
- | - | - | - | - | - | (1,918 | ) | (1,918 | ) | ||||||||||||||||||||||
|
Common
stock issued in restricted stock plan
|
2,000 | 20 | - | - | - | (20 | ) | - | - | |||||||||||||||||||||||
|
Stock
based compensation - stock options
|
- | - | - | - | - | 82,036 | - | 82,036 | ||||||||||||||||||||||||
|
Restricted
stock cancellations
|
(8,325 | ) | (84 | ) | - | - | - | 84 | - | - | ||||||||||||||||||||||
|
Amortization
of deferred stock compensation
|
- | - | - | - | - | (198,672 | ) | - | (198,672 | ) | ||||||||||||||||||||||
|
Treasury
stock purchases
|
- | - | - | - | (532,521 | ) | - | - | (532,521 | ) | ||||||||||||||||||||||
|
Treasury
stock retired
|
(31,700 | ) | (317 | ) | - | - | 487,480 | (487,163 | ) | - | - | |||||||||||||||||||||
|
Net
loss
|
- | - | - | - | - | - | (22,591,300 | ) | (22,591,300 | ) | ||||||||||||||||||||||
|
Balance,
September 30, 2009
|
613,343 | 6,133 | 127,840 | 10,866 | (45,041 | ) | 20,280,377 | (7,044,787 | ) | 13,207,548 | ||||||||||||||||||||||
|
Series
E preferred stock dividends
|
- | - | - | - | - | - | (1,918 | ) | (1,918 | ) | ||||||||||||||||||||||
|
Stock
based compensation - stock options
|
- | - | - | - | - | 38,448 | - | 38,448 | ||||||||||||||||||||||||
|
Restricted
stock cancellations
|
(3,700 | ) | (37 | ) | - | - | - | 37 | - | - | ||||||||||||||||||||||
|
Amortization
of deferred stock compensation
|
- | - | - | - | - | 117,373 | - | 117,373 | ||||||||||||||||||||||||
|
Treasury
stock purchases
|
- | - | - | - | (25,882 | ) | - | - | (25,882 | ) | ||||||||||||||||||||||
|
Net
loss
|
- | - | - | - | - | - | (7,456,718 | ) | (7,456,718 | ) | ||||||||||||||||||||||
|
Balance,
September 30, 2010
|
609,643 | $ | 6,096 | 127,840 | $ | 10,866 | $ | (70,923 | ) | $ | 20,436,235 | $ | (14,503,423 | ) | $ | 5,878,851 | ||||||||||||||||
|
Year ended September 30,
|
||||||||
|
2010
|
2009
|
|||||||
|
CASH
FLOWS FROM OPERATING ACTIVITIES:
|
||||||||
|
Net
loss
|
$ | (7,456,718 | ) | $ | (22,591,300 | ) | ||
|
Adjustments
to reconcile net loss to net cash
|
||||||||
|
provided
by (used in) operating activities:
|
||||||||
|
Depreciation
and amortization
|
873,572 | 2,297,626 | ||||||
|
Non-cash
stock compensation expense
|
38,448 | 82,036 | ||||||
|
Amortization
of stock-based compensation
|
117,373 | (198,672 | ) | |||||
|
Deferred
income taxes
|
- | 4,812,623 | ||||||
|
Provision
for uncollectible accounts
|
921,804 | 2,703,067 | ||||||
|
Noncash
impairment of goodwill and other intangibles
|
- | 16,111,494 | ||||||
|
Gain
on sale of customer list
|
- | (3,040,952 | ) | |||||
|
Gain
on sale of internet domain name
|
- | (3,805,778 | ) | |||||
|
Gain
on amendment of directory services contract
|
- | (642,268 | ) | |||||
|
(Gain)
loss on disposal of equipment
|
27,647 | 36,693 | ||||||
|
Changes
in assets and liabilities:
|
||||||||
|
Accounts
receivable
|
317,109 | 3,116,762 | ||||||
|
Prepaid
and other current assets
|
107,321 | 10,352 | ||||||
|
Deposits
and other assets
|
31,918 | 2,335 | ||||||
|
Accounts
payable
|
(195,241 | ) | (529,031 | ) | ||||
|
Accrued
liabilities
|
(214,541 | ) | (324,867 | ) | ||||
|
Income
taxes receivable
|
1,490,835 | (1,003,303 | ) | |||||
|
Net
cash used in operating activities
|
(3,940,473 | ) | (2,963,183 | ) | ||||
|
CASH
FLOWS FROM INVESTING ACTIVITIES:
|
||||||||
|
Proceeds
from sale of internet domain name
|
- | 3,850,000 | ||||||
|
Proceeds
from sale of customer list
|
- | 2,937,501 | ||||||
|
Proceeds
from amendment of directory services contract
|
- | 642,268 | ||||||
|
Proceeds
from sale of property and equipment
|
5,000 | - | ||||||
|
Expenditures
for intangible assets
|
(235,012 | ) | (734,878 | ) | ||||
|
Investment
in certificates of deposits
|
(1,293 | ) | (100,000 | ) | ||||
|
Purchases
of equipment
|
(54,921 | ) | (100,821 | ) | ||||
|
Net
cash provided by (used in) investing activities
|
(286,226 | ) | 6,494,070 | |||||
|
CASH
FLOWS FROM FINANCING ACTIVITIES:
|
||||||||
|
Principal
repayments on capital lease obligations
|
(88,075 | ) | (70,123 | ) | ||||
|
Purchase
of treasury stock
|
(25,882 | ) | (532,521 | ) | ||||
|
Net
cash used in financing activities
|
(113,957 | ) | (602,644 | ) | ||||
|
INCREASE
(DECREASE) IN CASH AND CASH EQUIVALENTS
|
(4,340,656 | ) | 2,928,243 | |||||
|
CASH
AND CASH EQUIVALENTS, beginning of year
|
7,568,030 | 4,639,787 | ||||||
|
CASH
AND CASH EQUIVALENTS, end of year
|
$ | 3,227,374 | $ | 7,568,030 | ||||
|
Supplemental
cash flow disclosures:
|
||||||||
|
Cash
paid for interest
|
$ | 5,842 | $ | - | ||||
|
Cash
paid for income taxes
|
$ | 1,600 | $ | 1,860 | ||||
|
Noncash
financing and investing activities:
|
||||||||
|
Acquistion
of equipment under capital leases
|
$ | - | $ | 24,821 | ||||
|
Accrued
and unpaid dividends
|
$ | 1,918 | $ | 1,918 | ||||
|
1.
|
ORGANIZATION AND BASIS OF
PRESENTATION
|
|
|
·
|
Telco Billing, Inc. was formed in
April 1998 to provide advertising and directory listings for businesses on
its Internet website in a “Yellow Pages” format. Telco provides
those services to its subscribers for a monthly fee. These
services are provided primarily to businesses throughout the United
States. Telco became a wholly owned subsidiary of the Company after the June 1999
acquisition.
|
|
|
·
|
At
the time that the transaction was agreed to, the Company had 12,567,770
common shares issued and outstanding. As a result of the merger
transaction with Telco, there were 29,567,770 common shares outstanding,
and the former Telco stockholders held approximately 57% of the Company’s
voting stock. For financial accounting purposes, the
acquisition was a reverse acquisition of the Company by Telco, under the
purchase method of accounting, and was treated as a recapitalization with
Telco as the acquirer. Consistent with reverse acquisition
accounting, (i) all of Telco’s assets, liabilities, and accumulated
deficit were reflected at their combined historical cost (as the
accounting acquirer) and (ii) the preexisting outstanding shares of the
Company (the accounting acquiree) were reflected at their net asset value
as if issued on June 16, 1999.
|
|
|
·
|
On
June 6, 2007, the Company completed its acquisition of LiveDeal, Inc.
(“LiveDeal”), a California corporation. LiveDeal operated an
online local classifieds marketplace, www.livedeal.com, which listed
millions of goods and services for sale across the United
States. The technology acquired in the acquisition offered such
classifieds functionality as fraud protection, identity protection,
e-commerce, listing enhancements, photos, community-building, package
pricing, premium stores, featured Yellow Page business listings and
advanced local search capabilities. This business has since
been discontinued – see Note 5.
|
|
|
·
|
On
July 10, 2007, the Company acquired substantially all of the assets and
assumed certain liabilities of OnCall Subscriber Management Inc., a
Manila, Philippines-based company that provided telemarketing
services. The acquisition took place through the Company’s
wholly-owned subsidiary, 247 Marketing LLC, a Nevada limited liability
company, which remains in existence but is
inactive.
|
|
|
·
|
On
August 10, 2007, the Company filed amended and restated articles of
incorporation with the Office of the Secretary of State of the State of
Nevada, pursuant to which the Company’s name was changed to LiveDeal,
Inc., effective August 15, 2007. The name change was approved
by the Company’s Board of Directors pursuant to discretion granted to it
by the Company’s stockholders at a special meeting on August 2,
2007.
|
|
|
·
|
During
2009, the Company made strategic changes that impacted the Company’s
consolidated financial statements in the following
manner:
|
|
|
o
|
Impairment charges of $16,111,494
were recorded related to the write-down of the Company’s goodwill and
other intangible assets as discussed in Note
4;
|
|
|
o
|
The Company commenced a plan to
discontinue its classifieds business and initiated shutdown activities, as
discussed in Note 5, and has reflected the operating results of this line
of business as discontinued operations in the accompanying consolidated
statements of operations;
|
|
|
o
|
The Company sold a portion of its
customer list associated with its directory services business and recorded
a gain of $3,040,952, as discussed in Note 14;
and
|
|
|
o
|
The Company established a
valuation allowance of $10,586,854 related to its deferred tax assets, as
described in Note 10.
|
|
|
·
|
During 2010, the Company formed
the wholly-owned subsidiaries Local Marketing Experts, Inc. and Velocity
Marketing Concepts, Inc.
|
|
2.
|
SUMMARY OF SIGNIFICANT ACCOUNTING
POLICIES
|
|
3.
|
BALANCE SHEET
INFORMATION
|
|
September 30,
|
September 30,
|
|||||||
|
2010
|
2009
|
|||||||
|
Receivables,
current, net:
|
||||||||
|
Accounts
receivable, current
|
$ | 2,750,393 | $ | 3,776,966 | ||||
|
Less:
Allowance for doubtful accounts
|
(1,801,954 | ) | (2,298,783 | ) | ||||
| $ | 948,439 | $ | 1,478,183 | |||||
|
Receivables,
long term, net:
|
||||||||
|
Accounts
receivable, long term
|
$ | 680,108 | $ | 1,581,946 | ||||
|
Less:
Allowance for doubtful accounts
|
(349,874 | ) | (542,543 | ) | ||||
| $ | 330,234 | $ | 1,039,403 | |||||
|
Total
receivables, net:
|
||||||||
|
Gross
receivables
|
$ | 3,430,501 | $ | 5,358,912 | ||||
|
Allowance
for doubtful accounts
|
(2,151,828 | ) | (2,841,326 | ) | ||||
| $ | 1,278,673 | $ | 2,517,586 | |||||
|
Components
of allowance for doubtful accounts are as follows:
|
||||||||
|
September
30,
|
September
30,
|
|||||||
|
2010
|
2009
|
|||||||
|
Allowance
for dilution and fees on amounts due
from billing aggregators
|
$ | 2,104,826 | $ | 2,690,895 | ||||
|
Allowance
for customer refunds
|
47,002 | 150,431 | ||||||
| $ | 2,151,828 | $ | 2,841,326 | |||||
|
September
30,
|
September
30,
|
|||||||
|
2010
|
2009
|
|||||||
|
Property
and equipment, net:
|
||||||||
|
Leasehold
improvements
|
$ | 239,271 | $ | 235,056 | ||||
|
Furnishings
and fixtures
|
319,004 | 336,067 | ||||||
|
Office,
computer equipment and other
|
704,388 | 692,317 | ||||||
| 1,262,663 | 1,263,440 | |||||||
|
Less:
Accumulated depreciation
|
(865,281 | ) | (647,534 | ) | ||||
| $ | 397,382 | $ | 615,906 | |||||
|
September
30,
|
September
30,
|
|||||||
|
2010
|
2009
|
|||||||
|
Intangible
assets, net:
|
||||||||
|
Domain
name and marketing related intangibles
|
$ | 1,509,600 | $ | 6,699,600 | ||||
|
Non-compete
agreements
|
- | 3,465,000 | ||||||
|
Website
and technology related intangibles
|
1,914,991 | 4,678,970 | ||||||
| 3,424,591 | 14,843,570 | |||||||
|
Less: Accumulated
amortization
|
(1,485,639 | ) | (12,506,856 | ) | ||||
| $ | 1,938,952 | $ | 2,336,714 | |||||
|
September
30,
|
September
30,
|
|||||||
|
2010
|
2009
|
|||||||
|
Accrued
liabilities:
|
||||||||
|
Deferred
revenue
|
$ | 87,574 | $ | 148,916 | ||||
|
Accrued
payroll and bonuses
|
124,544 | 289,944 | ||||||
|
Accruals
under revenue sharing agreements
|
133,119 | 314,754 | ||||||
|
Accrued
expenses - other
|
534,951 | 339,197 | ||||||
| $ | 880,188 | $ | 1,092,811 | |||||
|
September
30,
|
September
30,
|
|||||||
|
2010
|
2009
|
|||||||
|
Customer
acquisition costs, net:
|
||||||||
|
Customer
acquisition costs
|
$ | 1,700,000 | $ | 1,700,000 | ||||
|
Less: Accumulated
amortization
|
(1,700,000 | ) | (1,700,000 | ) | ||||
| $ | - | $ | - | |||||
|
4.
|
INTANGIBLE
ASSETS
|
|
|
1.
|
The
goodwill acquired by the Company in its acquisition of LiveDeal, Inc., the
business focus of which was online classified advertising which was
originally intended to be merged with the Company’s existing directory
services business;
|
|
|
2.
|
The
goodwill acquired by the Company in its acquisition of a Philippines
call-center, OnCall Subscriber Management, the business focus of which was
providing telemarketing services to acquire customers for its directory
services business;
|
|
|
3.
|
Assets
related to the Company’s call-center operations and non-compete agreements
that were effectively made obsolete due to the sale of a portion of the
Company’s customer list associated with its directory services business,
as described in Note 14; and
|
|
|
4.
|
Intangible
assets related to the Company’s directory services business, including
URLs, internally developed software, and other miscellaneous intangible
assets.
|
|
Continuing
Operations
|
Discontinued
Operations
|
Total
Impairment
|
||||||||||
|
Goodwill
|
$ | 4,350,041 | $ | 7,356,365 | $ | 11,706,406 | ||||||
|
Domain
name and marketing related intangibles
|
1,879,054 | - | 1,879,054 | |||||||||
|
Assets
related to customer list
|
1,259,680 | - | 1,259,680 | |||||||||
|
Website
and technology related intangibles
|
377,334 | 889,020 | 1,266,354 | |||||||||
| $ | 7,866,109 | $ | 8,245,385 | $ | 16,111,494 | |||||||
|
Years
ended September 30,
|
||||
|
2011
|
$ | 509,933 | ||
|
2012
|
290,648 | |||
|
2013
|
104,527 | |||
|
2014
|
77,422 | |||
|
2015
|
77,422 | |||
|
Thereafter
|
879,000 | |||
|
Total
|
$ | 1,938,952 | ||
|
5.
|
DISCONTINUED
OPERATIONS
|
|
6.
|
CAPITAL
LEASES
|
|
2011
|
$ | 64,143 | ||
|
2012
|
37,417 | |||
|
2013
|
- | |||
|
2014
|
- | |||
|
Thereafter
|
- | |||
|
Total
minimum lease payments
|
101,560 | |||
|
Less
imputed interest
|
(2,950 | ) | ||
|
Present
value of minimum lease payments
|
98,610 | |||
|
Less:
current maturities of capital lease obligations
|
60,327 | |||
|
Noncurrent
maturities of capital lease obligations
|
$ | 38,283 |
|
7.
|
STOCKHOLDERS’
EQUITY
|
|
8.
|
NET LOSS PER
SHARE
|
|
Year Ended September
30, 2010
|
Year Ended
September 30, 2009
|
|||||||
|
Net
loss from continuing operations
|
$ | (7,469,243 | ) | $ | (14,321,857 | ) | ||
|
Less:
preferred stock dividends
|
(1,918 | ) | (1,918 | ) | ||||
|
Loss
from continuing operations applicable to common stock
|
(7,471,161 | ) | (14,323,775 | ) | ||||
|
Gain
(loss) from discontinued operations
|
12,525 | (8,269,443 | ) | |||||
|
Net
loss applicable to common stock
|
$ | (7,458,636 | ) | $ | (22,593,218 | ) | ||
|
Basic
weighted average common shares outstanding:
|
599,928 | 600,566 | ||||||
|
Add
incremental shares for:
|
||||||||
|
Unvested
restricted stock
|
- | - | ||||||
|
Series
E convertible preferred stock
|
- | - | ||||||
|
Outstanding
warrants
|
- | - | ||||||
|
Diluted
weighted average common shares outstanding:
|
599,928 | 600,566 | ||||||
|
Earnings
per share - Basic:
|
||||||||
|
Loss
from continuing operations
|
$ | (12.45 | ) | $ | (23.84 | ) | ||
|
Discontinued
operations
|
0.02 | (13.76 | ) | |||||
|
Net
loss
|
$ | (12.43 | ) | $ | (37.60 | ) | ||
|
Earnings
per share - Diluted:
|
||||||||
|
Loss
from continuing operations
|
$ | (12.45 | ) | $ | (23.84 | ) | ||
|
Discontinued
operations
|
0.02 | (13.76 | ) | |||||
|
Net
loss
|
$ | (12.43 | ) | $ | (37.60 | ) | ||
|
September 30,
|
||||||||
|
2010
|
2009
|
|||||||
|
Options
to purchase shares of common stock
|
23,767 | 40,303 | ||||||
|
Series
E convertible preferred stock
|
127,840 | 127,840 | ||||||
|
Shares
of non-vested restricted stock
|
53,922 | 152,169 | ||||||
| 205,529 | 320,312 | |||||||
|
Payments Due by Fiscal Year
|
||||||||||||||||||||||||||||
|
Total
|
2011
|
2012
|
2013
|
2014
|
2015
|
Thereafter
|
||||||||||||||||||||||
|
Operating
lease commitments
|
$ | 813,516 | $ | 419,465 | $ | 315,331 | $ | 78,720 | $ | - | $ | - | $ | - | ||||||||||||||
|
Non-cancelable
service contracts
|
773,583 | 635,583 | 138,000 | - | - | - | - | |||||||||||||||||||||
| $ | 1,587,099 | $ | 1,055,048 | $ | 453,331 | $ | 78,720 | $ | - | $ | - | $ | - | |||||||||||||||
|
|
·
|
Fulfillment
and Marketing Agreement dated October 10, 2007, by and between the Company
and Sharednet.
|
|
|
·
|
Fulfillment
and Marketing Agreement dated October 16, 2007, by and between the Company
and OneSource Web Hosting.
|
|
|
·
|
Fulfillment
and Marketing Agreement dated October 10, 2007, by and between the Company
and Blabb1e Networks.
|
|
10.
|
PROVISION
FOR INCOME TAXES
|
|
2010
|
2009
|
|||||||
|
Current
provision (benefit)
|
$ | (230,382 | ) | $ | (1,071,763 | ) | ||
|
Deferred
(benefit) provision
|
- | 4,405,251 | ||||||
|
Net
income tax (benefit) provision
|
$ | (230,382 | ) | $ | 3,333,488 | |||
|
2010
|
2009
|
|||||||||||||||
|
Amount
|
Percent
|
Amount
|
Percent
|
|||||||||||||
|
Federal
statutory rates
|
$ | (2,613,614 | ) | 34 | % | $ | (6,547,656 | ) | 381 | % | ||||||
|
State
income taxes
|
(258,378 | ) | 3 | % | (647,294 | ) | 38 | % | ||||||||
|
Write
off of deferred tax asset
|
||||||||||||||||
|
related
to vested restricted stock
|
50,905 | (1 | )% | 48,570 | (3 | )% | ||||||||||
|
Valuation
allowance against net
|
||||||||||||||||
|
deferred
tax assets
|
2,786,003 | (36 | )% | 10,586,854 | (55 | )% | ||||||||||
|
Other
|
(195,298 | ) | 3 | % | (106,986 | ) | 6 | % | ||||||||
|
Effective
rate
|
$ | (230,382 | ) | 3 | % | $ | 3,333,488 | (194 | )% | |||||||
|
2010
|
2009
|
|||||||
|
Deferred
income tax asset, current:
|
||||||||
|
Book
to tax differences in accounts receivable
|
$ | 643,209 | $ | 1,118,416 | ||||
|
Book
to tax differences in prepaid assets and accrued expenses
|
(43,011 | ) | (34,829 | ) | ||||
|
Total
deferred income tax asset, current
|
600,198 | 1,083,587 | ||||||
|
Less:
valuation allowance
|
(600,198 | ) | (1,083,587 | ) | ||||
|
Deferred
income tax asset, current, net
|
- | - | ||||||
|
Deferred
income tax asset, long-term:
|
||||||||
|
Net
operating loss carryforwards
|
7,084,995 | 3,481,786 | ||||||
|
Book
to tax differences for stock based compensation
|
187,614 | 218,565 | ||||||
|
Book
to tax differences in intangible assets
|
7,234,473 | 7,377,360 | ||||||
|
Book
to tax differences in other assets
|
326 | 326 | ||||||
|
Book
to tax differences in depreciation
|
(1,734,750 | ) | (1,574,770 | ) | ||||
|
Total
deferred income tax asset, long-term
|
12,772,658 | 9,503,267 | ||||||
|
Less:
valuation allowance
|
(12,772,658 | ) | (9,503,267 | ) | ||||
|
Deferred
income tax asset, net
|
- | - | ||||||
|
Total
deferred income tax asset
|
$ | - | $ | - | ||||
|
11.
|
CONCENTRATION OF CREDIT
RISK
|
|
Outstanding
(unvested) at September 30, 2008
|
22,743 | |||
|
Granted
|
2,000 | |||
|
Forfeited
|
(8,325 | ) | ||
|
Vested
|
(5,775 | ) | ||
|
Outstanding
(unvested) at September 30, 2009
|
10,643 | |||
|
Granted
|
- | |||
|
Forfeited
|
(3,700 | ) | ||
|
Vested
|
(2,285 | ) | ||
|
Outstanding
(unvested) at September 30, 2010
|
4,658 |
|
Year
Ended
|
Year
Ended
|
|||||||
|
September 30, 2010
|
September 30, 2009
|
|||||||
|
Volatility
|
97 | % | 97 | % | ||||
|
Risk-free
interest rate
|
2.2 | % | 1.7%-2.8 | % | ||||
|
Expected
term
|
6.0
years
|
6.0
years
|
||||||
|
Forfeiture
rate
|
40 | % | 40 | % | ||||
|
Dividend
yield rate
|
0 | % | 0 | % | ||||
|
Weighted
|
Weighted
|
Weighted
|
||||||||||||||||||
|
Average
|
Average
|
Average
|
Aggregate
|
|||||||||||||||||
|
Number
of
|
Exercise
|
Fair
|
Remaining
|
Intrinsic
|
||||||||||||||||
|
Shares
|
Price
|
Value
|
Contractual Life
|
Value
|
||||||||||||||||
|
Outstanding
at September 30, 2009
|
33,000 | |||||||||||||||||||
|
Granted
at market price
|
25,000 | $ | 19.50 | n/m | ||||||||||||||||
|
Exercised
|
- | $ | - | |||||||||||||||||
|
Forfeited
|
(53,000 | ) | $ | 17.00 | ||||||||||||||||
|
Outstanding
at September 30, 2010
|
5,000 | $ | 14.50 | 8.1 | $ | - | ||||||||||||||
|
Exercisable
|
2,292 | $ | 14.50 | 8.1 | $ | - | ||||||||||||||
|
13.
|
EMPLOYEE BENEFIT
PLAN
|
|
14.
|
OTHER INCOME
(EXPENSE)
|
|
15.
|
SEGMENT
REPORTING
|
|
Year Ended September 30,
2010
|
||||||||||||||||
|
Directory Services
|
Direct Sales -
Customer
Acquisition
Services
|
Unallocated
|
Consolidated
|
|||||||||||||
|
Net
revenues
|
$ | 4,238,955 | $ | 3,838,479 | $ | - | $ | 8,077,434 | ||||||||
|
Cost
of services
|
761,154 | 3,096,530 | - | 3,857,684 | ||||||||||||
|
Gross
profit
|
3,477,801 | 741,949 | - | 4,219,750 | ||||||||||||
|
Operating
expenses
|
- | - | 11,960,564 | 11,960,564 | ||||||||||||
|
Operating
income (loss)
|
3,477,801 | 741,949 | (11,960,564 | ) | (7,740,814 | ) | ||||||||||
|
Other
income (expense)
|
- | - | 41,189 | 41,189 | ||||||||||||
|
Income
(loss) before income taxes and discontinued operations
|
$ | 3,477,801 | $ | 741,949 | $ | (11,919,375 | ) | $ | (7,699,625 | ) | ||||||
|
Year Ended September 30,
2009
|
||||||||||||||||
|
Directory Services
|
Direct Sales -
Customer
Acquisition
Services
|
Unallocated
|
Consolidated
|
|||||||||||||
|
Net
revenues
|
$ | 9,331,057 | $ | 4,107,598 | $ | - | $ | 13,438,655 | ||||||||
|
Cost
of services
|
3,624,177 | 2,767,601 | - | 6,391,778 | ||||||||||||
|
Gross
profit
|
5,706,880 | 1,339,997 | - | 7,046,877 | ||||||||||||
|
Operating
expenses
|
- | - | 25,503,153 | 25,503,153 | ||||||||||||
|
Operating
income (loss)
|
5,706,880 | 1,339,997 | (25,503,153 | ) | (18,456,276 | ) | ||||||||||
|
Other
income (expense)
|
- | - | 7,527,934 | 7,527,934 | ||||||||||||
|
Income
before income taxes and discontinued operations
|
$ | 5,706,880 | $ | 1,339,997 | $ | (17,975,219 | ) | $ | (10,928,342 | ) | ||||||
|
September 30, 2010
|
||||||||||||
|
Directory Services
|
Direct Sales -
Customer
Acquisition
Services
|
Total
|
||||||||||
|
Accounts
receivable, net - short term
|
$ | 872,977 | $ | 75,462 | $ | 948,439 | ||||||
|
Accounts
receivable, net - long term
|
330,234 | - | 330,234 | |||||||||
|
Total
accounts receivable, net
|
$ | 1,203,211 | $ | 75,462 | $ | 1,278,673 | ||||||
|
September 30, 2009
|
||||||||||||
|
Directory Services
|
Direct Sales -
Customer
Acquisition
Services
|
Total
|
||||||||||
|
Accounts
receivable, net - short term
|
$ | 1,442,037 | $ | 36,146 | $ | 1,478,183 | ||||||
|
Accounts
receivable, net - long term
|
1,039,403 | - | 1,039,403 | |||||||||
|
Total
accounts receivable, net
|
$ | 2,481,440 | $ | 36,146 | $ | 2,517,586 | ||||||
|
Quarter Ended
|
||||||||||||||||
|
December
31,
|
March
31,
|
June
30,
|
September
30,
|
|||||||||||||
|
2009
|
2010
|
2010
|
2010
|
|||||||||||||
|
Net
revenues
|
$ | 2,477,447 | $ | 2,165,653 | $ | 1,651,107 | $ | 1,783,227 | ||||||||
|
Gross
profit
|
1,648,633 | 1,143,314 | 1,014,749 | 413,054 | ||||||||||||
|
Loss
from continuing operations
|
(2,527,378 | ) | (1,773,522 | ) | (1,339,934 | ) | (1,828,409 | ) | ||||||||
|
Income
(loss) from discontinued operations
|
1,725 | - | - | 10,800 | ||||||||||||
|
Net
loss
|
$ | (2,525,653 | ) | $ | (1,773,522 | ) | $ | (1,339,934 | ) | $ | (1,817,609 | ) | ||||
|
Earnings
per share information:
|
||||||||||||||||
|
Basic
income per share
|
||||||||||||||||
|
Loss
from continuing operations
|
$ | (4.22 | ) | $ | (2.96 | ) | $ | (2.23 | ) | $ | (3.05 | ) | ||||
|
Discontinued
operations
|
- | - | - | 0.02 | ||||||||||||
|
Net
loss
|
$ | (4.21 | ) | $ | (2.96 | ) | $ | (2.23 | ) | $ | (3.03 | ) | ||||
|
Diluted
income per share
|
||||||||||||||||
|
Loss
from continuing operations
|
$ | (4.22 | ) | $ | (2.96 | ) | $ | (2.23 | ) | $ | (3.05 | ) | ||||
|
Discontinued
operations
|
- | - | - | 0.02 | ||||||||||||
|
Net
loss
|
$ | (4.21 | ) | $ | (2.96 | ) | $ | (2.23 | ) | $ | (3.03 | ) | ||||
|
Quarter Ended
|
||||||||||||||||
|
December
31,
|
March
31,
|
June
30,
|
September
30,
|
|||||||||||||
|
2008
|
2009
|
2009
|
2009
|
|||||||||||||
|
Net
revenues
|
$ | 5,009,514 | $ | 3,548,275 | $ | 2,448,569 | $ | 2,432,297 | ||||||||
|
Gross
profit
|
3,408,864 | 2,081,393 | 1,636,248 | (79,628 | ) | |||||||||||
|
Income
(loss) from continuing operations
|
944,440 | (10,797,953 | ) | (2,116,971 | ) | (2,351,373 | ) | |||||||||
|
Income
(loss) from discontinued operations
|
(57,077 | ) | (8,285,663 | ) | 4,649 | 68,648 | ||||||||||
|
Net
income (loss)
|
$ | 887,362 | $ | (19,083,616 | ) | $ | (2,112,322 | ) | $ | (2,282,725 | ) | |||||
|
Earnings
per share information:
|
||||||||||||||||
|
Basic
income per share
|
||||||||||||||||
|
Income
(loss) from continuing operations
|
$ | 1.56 | $ | (18.04 | ) | $ | (3.53 | ) | $ | (3.92 | ) | |||||
|
Discontinued
operations
|
$ | (0.09 | ) | $ | (13.85 | ) | $ | 0.01 | $ | 0.12 | ||||||
|
Net
income (loss)
|
$ | 1.47 | $ | (31.89 | ) | $ | (3.52 | ) | $ | (3.80 | ) | |||||
|
Diluted
income per share
|
||||||||||||||||
|
Income
(loss) from continuing operations
|
$ | 1.55 | $ | (18.04 | ) | $ | (3.53 | ) | $ | (3.92 | ) | |||||
|
Discontinued
operations
|
(0.09 | ) | (13.85 | ) | 0.01 | 0.12 | ||||||||||
|
Net
income (loss)
|
$ | 1.46 | $ | (31.89 | ) | $ | (3.52 | ) | $ | (3.80 | ) | |||||
|
ITEM 10.
|
Directors, Executive Officers and
Corporate Governance
|
|
ITEM 11.
|
Executive
Compensation
|
|
ITEM 12.
|
Security Ownership of Certain
Beneficial Owners and Management and Related Stockholder
Matters
|
|
ITEM 13.
|
Certain Relationships and Related
Transactions, and Director
Independence
|
|
ITEM 14.
|
Principal Accounting Fees and
Services
|
|
ITEM 15.
|
Exhibits and Financial Statement
Schedules
|
|
(1)
|
Financial Statements are listed
on the Index to Consolidated Financial Statements on page 28 of this
Annual Report.
|
|
(2)
|
The following represents
financial statement schedules required to be filed with this Annual
Report:
|
|
/s/ Mayer Hoffman McCann
P.C.
|
|
Balance at
|
Charged to
|
Charged to
|
|
Balance at
|
||||||||||||||||
|
Beginning
|
Costs
and
|
Other
|
Deductions/
|
End
of
|
||||||||||||||||
|
Description
|
of
Period
|
Expenses
|
Accounts
|
Writeoffs
|
Period
|
|||||||||||||||
|
Allowance
for dilution and fees on amounts due from billing
aggregators
|
||||||||||||||||||||
|
Year
ended September 30, 2009
|
$ | 1,775,276 | $ | 5,196,360 | $ | $ | (4,280,741 | ) | $ | 2,690,895 | ||||||||||
|
Year
ended September 30, 2010
|
$ | 2,690,895 | $ | (354,989 | ) | $ | $ | (231,080 | ) | $ | 2,104,826 | |||||||||
|
Allowance
for customer refunds
|
||||||||||||||||||||
|
Year
ended September 30, 2009
|
$ | 428,269 | $ | 2,511,706 | $ | $ | (2,789,544 | ) | $ | 150,431 | ||||||||||
|
Year
ended September 30, 2010
|
$ | 150,431 | $ | 553,214 | $ | $ | (656,643 | ) | $ | 47,002 | ||||||||||
|
Exhibit
Number
|
Description
|
Previously Filed as Exhibit
|
Date
Previously
Filed
|
|||
|
3.1
|
Amended
and Restated Articles of Incorporation
|
Exhibit
3.1 to the Registrant’s Current Report on Form 8-K filed on August 15,
2007
|
8/15/07
|
|||
|
3.1.1
|
Certificate
of Change
|
Exhibit
3.1 to the Registrant’s Current Report on Form 8-K filed on September 7,
2010
|
9/7/10
|
|||
|
3.2
|
Amended
and Restated Bylaws
|
Exhibit
3.2 to the Registrant’s Annual Report on Form 10-K for the fiscal year
ended September 30, 2007
|
12/20/07
|
|||
|
10.1
|
LiveDeal,
Inc. Amended and Restated 2003 Stock Plan*
|
Exhibit
10.1 to the Registrant’s Annual Report on Form 10-K for the fiscal year
ended September 30, 2007
|
12/20/07
|
|||
|
10.1.1
|
First
Amendment to Amended and Restated 2003 Stock Plan*
|
Appendix
A to 2009 Proxy Statement
|
1/29/09
|
|||
|
10.2
|
Form
of 2003 Stock Plan Restricted Stock Agreement*
|
Exhibit
10 to the Registrant’s Quarterly Report on Form 10-QSB for the fiscal
quarter ending March 31, 2005
|
5/16/05
|
|||
|
10.3
|
Form
of 2003 Stock Plan Stock Option Agreement*
|
Exhibit
10.3 to the Registrant’s Annual Report on Form 10-K for the fiscal year
ending September 30, 2008
|
12/29/08
|
|||
|
10.4
|
Standard
Industrial/Commercial Multi-Tenant Lease for Mesa facility, dated June 1,
1998, between the Registrant and Art Grandlich, d/b/a McKellips Corporate
Square
|
Exhibit
10.5 to the Registrant’s Annual Report on Form 10-KSB for the fiscal year
ended September 30, 1999
|
9/19/00
|
|||
|
10.4.1
|
Amendment
No. 1 to Standard Industrial/Commercial Multi-Tenant Lease for Mesa
facility, dated August 17, 1998, between the Registrant and Arthur
Grandlich, d/b/a McKellips Corporate Square
|
Exhibit
10.4 to the Registrant’s Annual Report on Form 10-K for the fiscal year
ended September 30, 2006
|
12/29/06
|
|||
|
10.4.2
|
Amendment
No. 2 to Standard Industrial/Commercial Multi-Tenant Lease for Mesa
facility, dated January 7, 2003, between the Registrant and Arthur
Grandlich, d/b/a McKellips Corporate Square
|
Exhibit
10.14 to Amendment No. 2 to the Registrant’s Annual Report on Form
10-KSB/A for the fiscal year ended September 30, 2002
|
7/8/03
|
|||
|
10.4.3
|
Amendment
No. 3 to Standard Industrial/Commercial Multi-Tenant Lease for Mesa
facility, dated March 23, 2006, between the Registrant and J3 Harmon,
LLC, successor in interest to The Estate of Arthur
Grandlich
|
Exhibit
10.4.2 to the Registrant’s Annual Report on Form 10-K for the fiscal year
ended September 30, 2006
|
12/29/06
|
|||
|
10.4.4
|
Amendment
No. 4 to Standard Industrial/Commercial Multi-Tenant Lease for Mesa
facility, dated April 12, 2006, between the Registrant and J3 Harmon,
LLC, successor in interest to The Estate of Arthur
Grandlich
|
Exhibit
10.4.3 to the Registrant’s Annual Report on Form 10-K for the fiscal year
ended September 30, 2006
|
12/29/06
|
|
10.5
|
Standard
Industrial Lease for Nevada facility, dated September 3, 2003, between the
Registrant and Tomorrow 33 Convention, LP
|
Exhibit
10.4 to the Registrant’s Annual Report on Form 10-KSB for the fiscal year
ended September 30, 2003
|
12/31/03
|
|||
|
10.6
|
Amendment
No. 1 to Standard Industrial Lease for Nevada facility, dated October 4,
2006, between the Registrant and Tomorrow 33 Convention,
LP
|
Exhibit
10.6 to the Registrant’s Annual Report on Form 10-K for the fiscal year
ended September 30, 2006
|
12/29/06
|
|||
|
10.7
|
Master
Services Agreement, dated August 1, 2002, between the Registrant and
eBillit, Inc.
|
Exhibit
10.24 to Amendment No. 1 to the Registrant’s Quarterly Report on Form
10-QSB/A for the fiscal quarter ended March 31, 2003
|
7/8/03
|
|||
|
10.8
|
Billings
and Related Services Agreement, dated September 1, 2001, between the
Registrant and ACI Communications, Inc.
|
Exhibit
10.33 to Amendment No. 2 to the Registrant’s Annual Report on Form
10-KSB/A for the fiscal year ended September 30, 2002
|
7/8/03
|
|||
|
10.9
|
Domain
Name Purchase and Transfer Agreement, dated November 5, 2008, between the
Registrant and YellowPages.com LLC
|
Exhibit
10.1 to the Registrant’s Quarterly Report on Form 10-Q for the quarterly
period ended December 31, 2008
|
2/17/09
|
|||
|
10.10
|
Asset
Purchase Agreement, dated as of March 9, 2009, by and among the
Registrant, Telco Billing, Inc., and Local.com Corporation
|
Exhibit
10.1 to the Registrant’s Quarterly Report on Form 10-Q for the quarterly
period ended March 31, 2009
|
5/15/09
|
|||
|
10.11
|
Settlement
Agreement and Mutual release, dated as of February 3, 2010 by and among
Oncall Superior Management, SM Ventures, LiveDeal, Inc. and Telco Billing,
Inc.
|
Exhbit
10.1 to the Registrant’s Quarterly Report on Form 10-Q for the quarterly
period ended March 31, 2010
|
5/14/10
|
|||
|
10.12
|
Stock
Purchase Agreement, dated as of November 29, 2010, by and between the
Registrant and Joint Corporation FeelTech Investment Unit
1
|
Attached
hereto
|
10.21
|
|||
|
14
|
Code
of Business Conduct and Ethics, Adopted December 31, 2003
|
Exhibit
14 to the Registrant’s Quarterly Report on Form 10-QSB for the period
ended March 31, 2004
|
5/13/04
|
|||
|
21
|
Company
Subsidiaries
|
Attached
hereto
|
||||
|
23
|
Consent
of Mayer Hoffman McCann P.C.
|
Attached
hereto
|
||||
|
31
|
Certifications
pursuant to SEC Release No. 33-8238, as adopted pursuant to Section 302 of
the Sarbanes-Oxley Act of 2002
|
Attached
hereto
|
||||
|
32
|
Certifications
pursuant to 18 U.S.C. Section 1350, as adopted pursuant to Section 906 of
the Sarbanes-Oxley Act of 2002
|
Attached
hereto
|
|
Dated: January
5, 2011
|
/s/Kevin A. Hall
|
|
Kevin
A. Hall
|
|
|
President
and Chief Operating Officer
|
|
|
(Principal Executive
Officer)
|
|
|
Dated: January
5, 2011
|
/s/ Larry Tomsic
|
|
Larry
Tomsic
|
|
|
Chief
Financial Officer
(Principal Financial and
Accounting Officer)
|
|
Signature
|
Title
|
Date
|
||
|
/s/ Richard D. Butler
|
Director
|
January
5, 2011
|
||
|
Richard
D. Butler
|
||||
|
/s/ Sheryle Bolton
|
Director
|
January
5, 2011
|
||
|
Sheryle
Bolton
|
||||
|
/s/ Thomas Clarke, Jr.
|
Director
|
January
5, 2011
|
||
|
Thomas
Clark, Jr
|
||||
|
/s/ Greg LeClaire
|
Director
|
January
5, 2011
|
||
|
Greg
LeClaire
|